
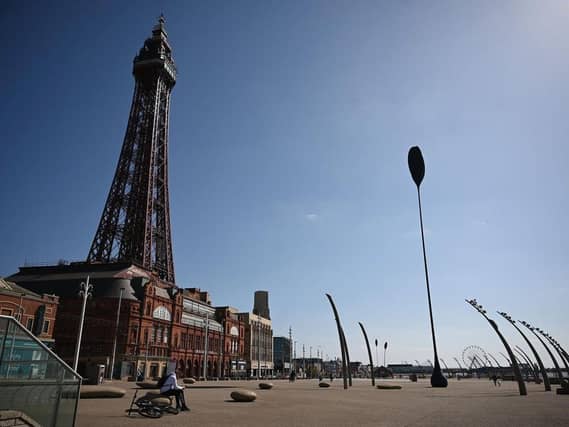

Almost one year on, the latest figures from the Office for National Statistics (ONS) show which areas have been hit hardest by Covid.
The data below shows the total number of deaths from all causes, and the number of deaths caused by Covid-19 that were registered between March 2020 and February 2021.
Here is how many people have died in each area of Blackpool since the start of the pandemic.
It is thanks to our loyal readers that we can continue to provide the trusted news, analysis and insight that matters to you. For unlimited access to our unrivalled local reporting, you can take out a subscription here and help support the work of our dedicated team of reporters.
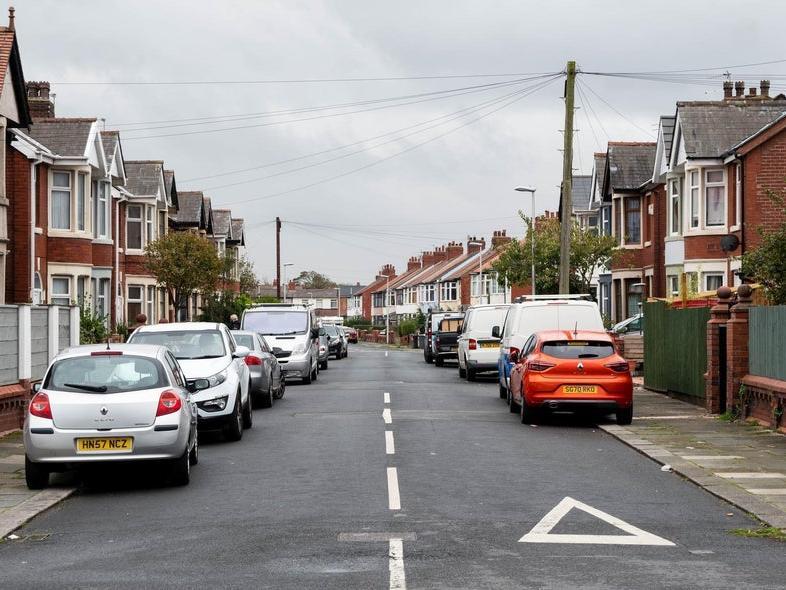
13. Victoria
In Victoria there have been 115 deaths from all causes between March 2020 and February 2021, with 18 (16%) of those deaths caused by Covid-19.
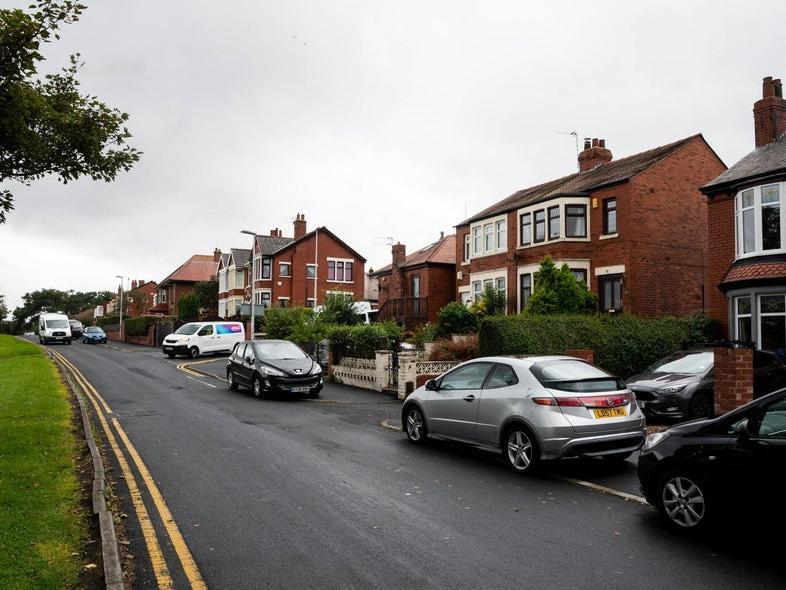
14. Queenstown & Layton
In Queenstown & Layton there have been 106 deaths from all causes between March 2020 and February 2021, with 16 (15%) of those deaths caused by Covid-19.
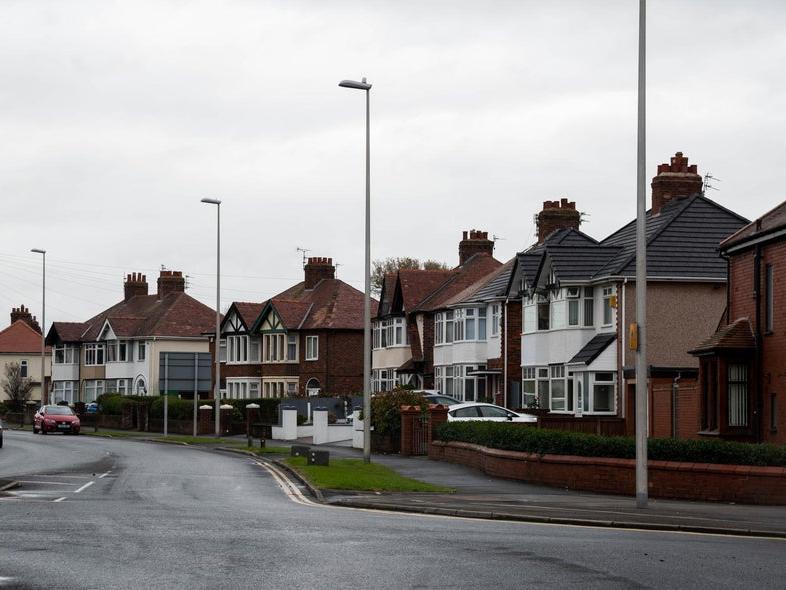
15. Hoohill
In Hoohill there have been 75 deaths from all causes between March 2020 and February 2021, with 10 (13%) of those deaths caused by Covid-19.
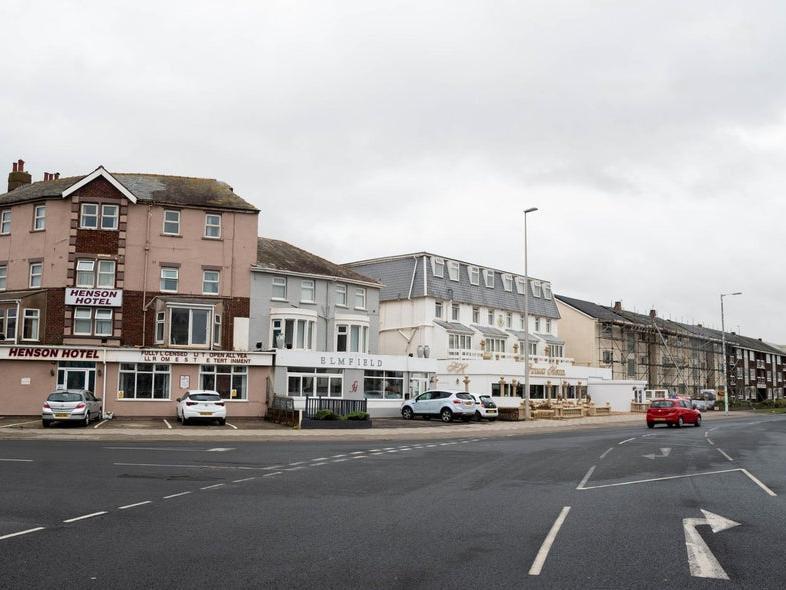
16. South Shore
In South Shore there have been 158 deaths from all causes between March 2020 and February 2021, with 18 (11%) of those deaths caused by Covid-19.
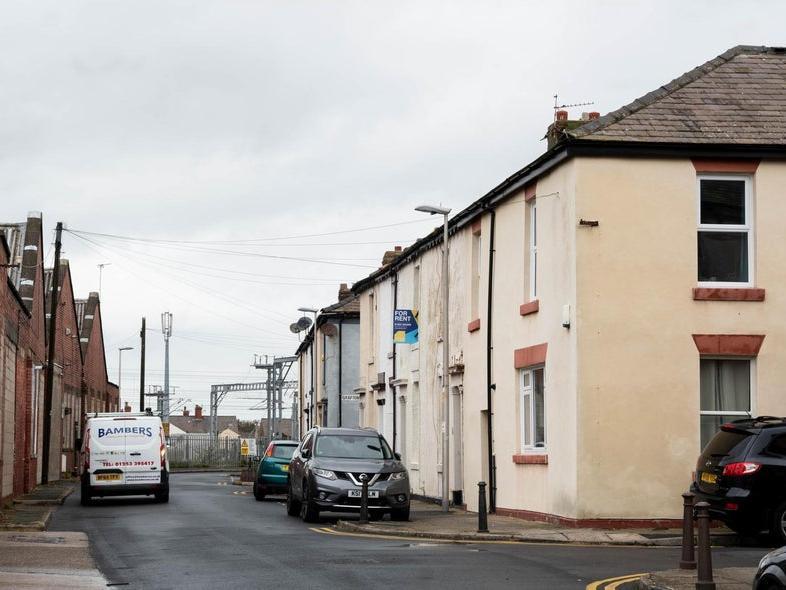
17. North East Centre
In North East Centre there have been 71 deaths from all causes between March 2020 and February 2021, with 8 (11%) of those deaths caused by Covid-19.
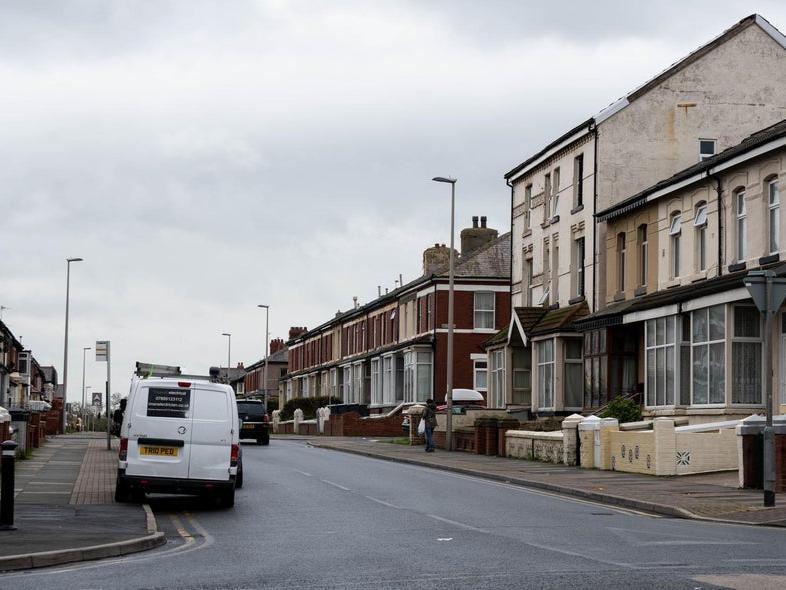
18. North Shore
In North Shore there have been 119 deaths from all causes between March 2020 and February 2021, with 13 (11%) of those deaths caused by Covid-19.