
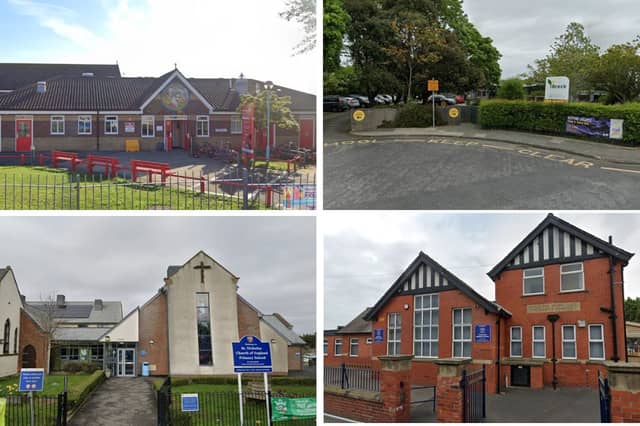


The latest official primary school league table sees each school awarded a score out of 120 for SAT assessments in reading and maths.
The average 'scaled’ scores' refer to Key Stage 2 assessments taken by pupils at the end of Year 6 in the summer of 2024.
The proportion of students meeting the ‘expected standard’ is included in the league table.
According to the Department for Education, pupils are meeting the expected standard if they achieve a scaled score of 100 or more in their reading and maths tests, and their teacher assesses them as 'working at the expected standard' or better in writing.
We have scoured the latest data to see which 15 schools on the Fylde Coast had the best performance.
You can also see the worst-performing Fylde Coast primary schools here.
The list excludes special schools. Not all schools had scores listed.
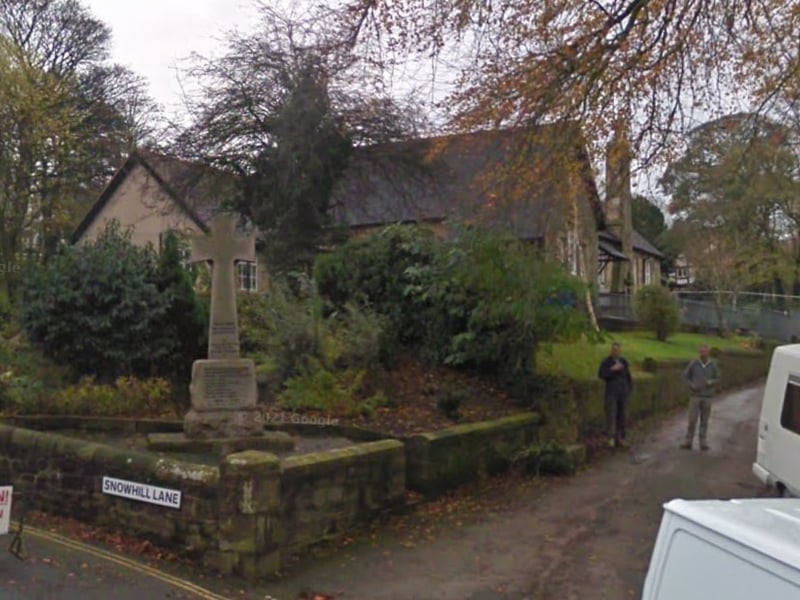
13. Scorton Church of England Primary School (no. 4)
91% of pupils met expected standard in reading, writing & maths at end of key stage 2 in 2024 | Google Maps
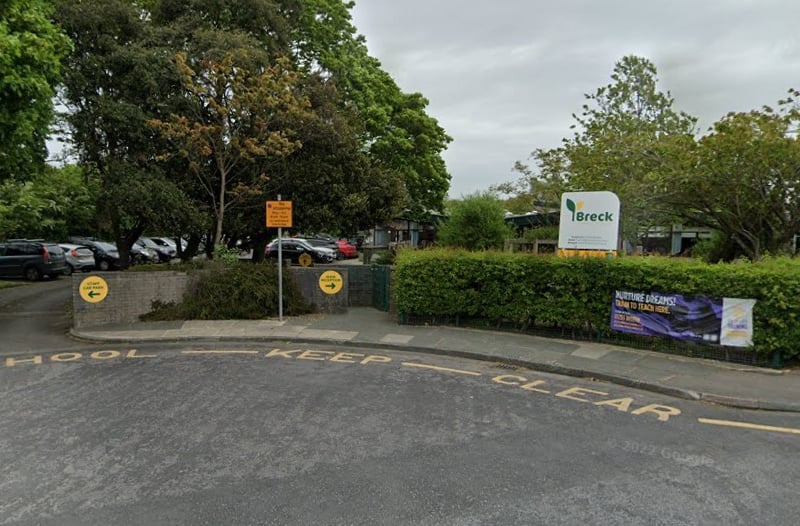
14. Poulton-le-Fylde the Breck Primary School (no. 3)
91% of pupils met expected standard in reading, writing & maths at end of key stage 2 in 2024 | Google Maps
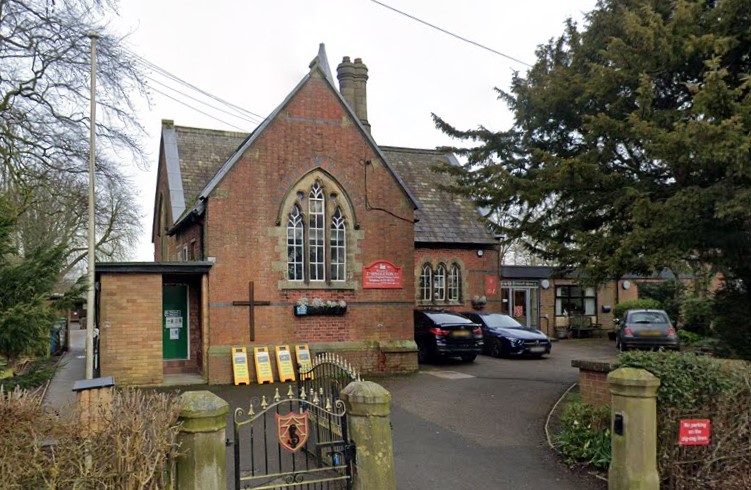
15. Singleton Church of England Voluntary Aided Primary School (no. 2)
92% of pupils met expected standard in reading, writing & maths at end of key stage 2 in 2024 | Google Maps
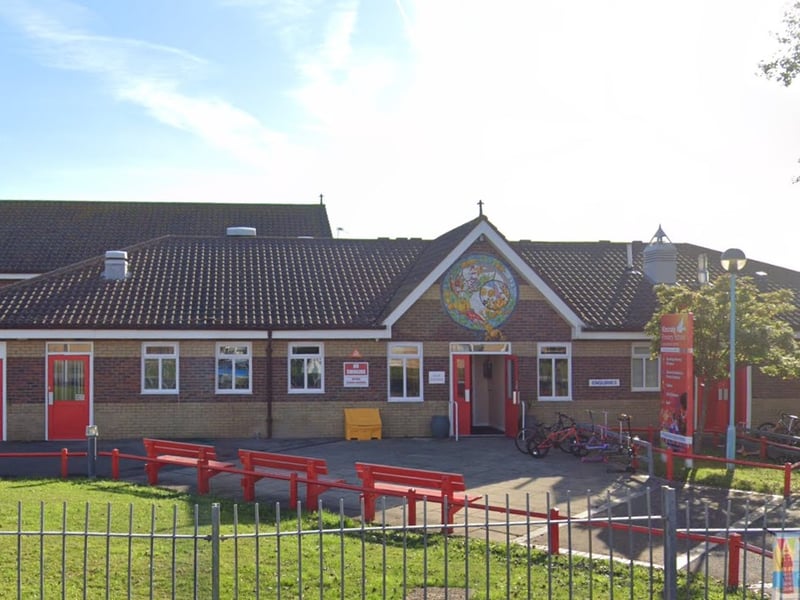
16. Kincraig Primary School (no. 1)
96% of pupils met expected standard in reading, writing & maths at end of key stage 2 in 2024 | Google Maps