

But some sides might argue their standing in the current placings doesn’t represent their performances so far this term.
That’s why, with the help of xG Data, we’ve put together an alternative table based on Expected Goals (or xG).
This is a metric that measures the quality of a chance by calculating the likelihood that it will be scored from a particular position on the pitch during a particular phase of play.
While the statistic isn’t fool-proof, it provides us with a useful marker of whether your club is currently under or over-performing.
Here’s how the alternative table looks:
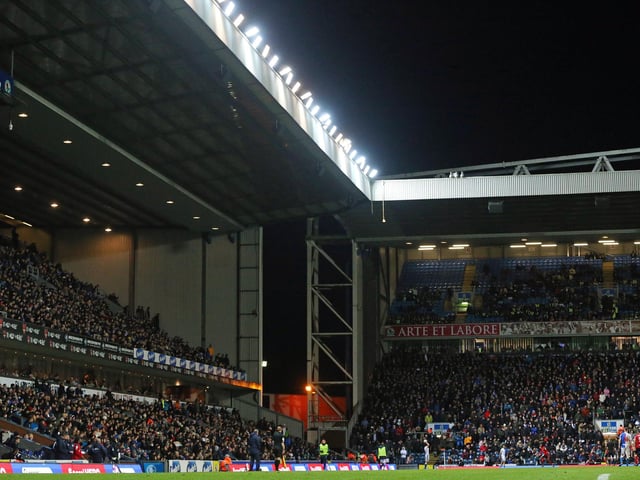
19. Blackburn Rovers - 12.2 points
Rovers should be 12 places lower in the table and 2.8 points worse off. Photo: CameraSport - Rich Linley
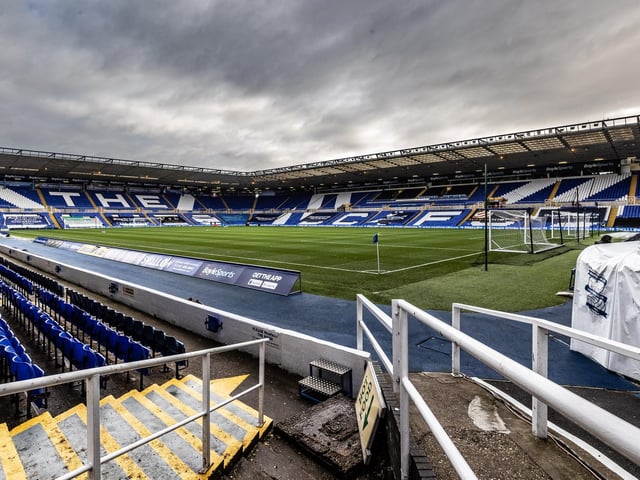
20. Birmingham City - 12 points
John Eustace's side should be three places lower in the table, but their current points haul is absolutely right. Photo: CameraSport - Andrew Kearns
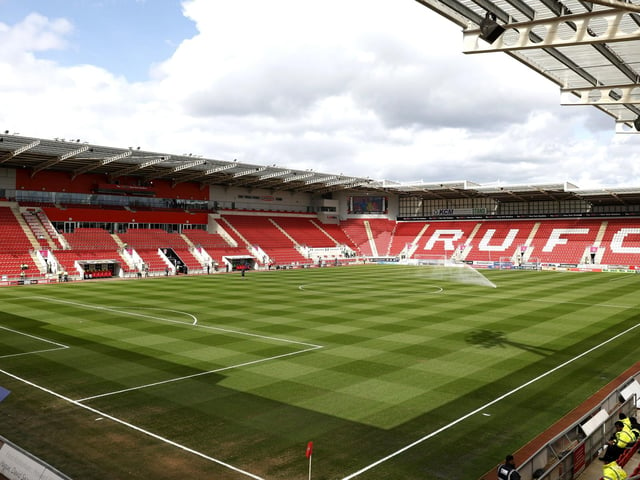
21. Rotherham United - 12 points
Paul Warne's side should be 13 places lower in the table and two points worse off. Photo: Richard Sellers
22. Huddersfield Town - 10 points
The Terriers should be one position and three points better off but still inside the bottom three. Photo: CameraSport - Alex Dodd
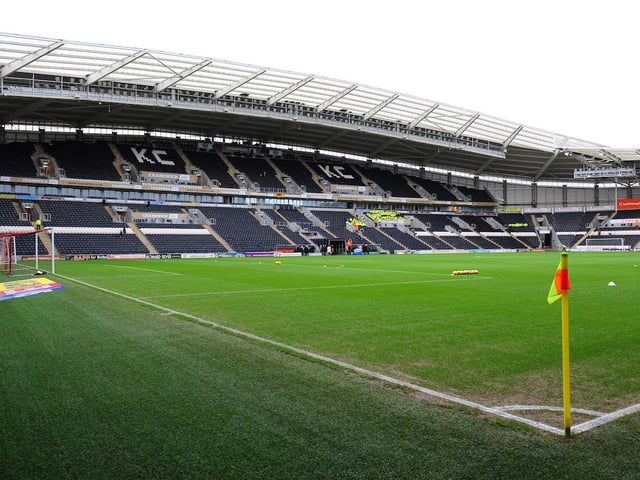
23. Hull City - 9.9 points
The Tigers should be three places lower and 1.1 points worse off. Photo: CameraSport - Chris Vaughan
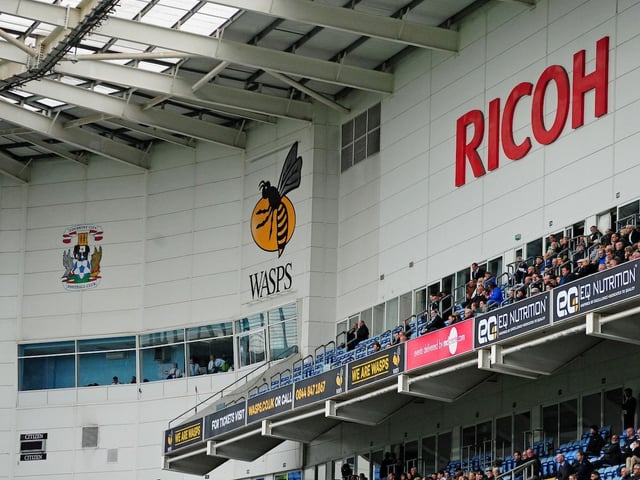
24. Coventry City - 8.3 points
Mark Robins' men should have 5.3 more points to their name, but this would still keep them bottom because of the games they've lost due to postponements. Photo: CameraSport - Chris Vaughan