


We have ranked Blackpool’s neighbourhoods by crime rates - specifically recorded incidents of anti-social behaviour (ASB).
The Police UK figures use Lancashire Constabulary’s crime numbers, which break down criminal offences reported in the city into specific areas.
Anti-social behaviour can refer to a variety incidents, from abandoning vehicles and general nuisance behaviour to trespassing or the misuse of fireworks. The data referred to within this article refers to ASB incidents reported to the police.
Blackpool is split into 19 Middle Layer Super Output Areas (MSOAs) - or neighbourhoods - and the figures refer to where the crimes occurred, not where they were reported from.
The data is for the period from December 2024 to November 2025 with the rankings based on the number of recorded offences per 1,000 residents in each neighbourhood.
We have ranked all 19 neighbourhoods in Blackpool, from lowest to highest overall recorded ASB incidents.
All photos are for illustrative purposes only and the data does not refer to any individual buildings or streets.
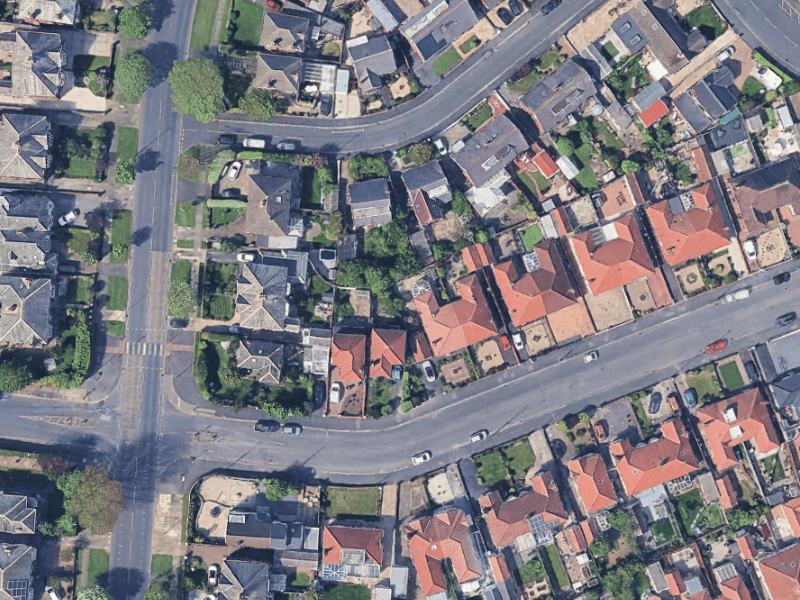
7. Churchtown
In the Churchtown area, there were 35.1 ASB reports per 1,000 residents. | Google Earth
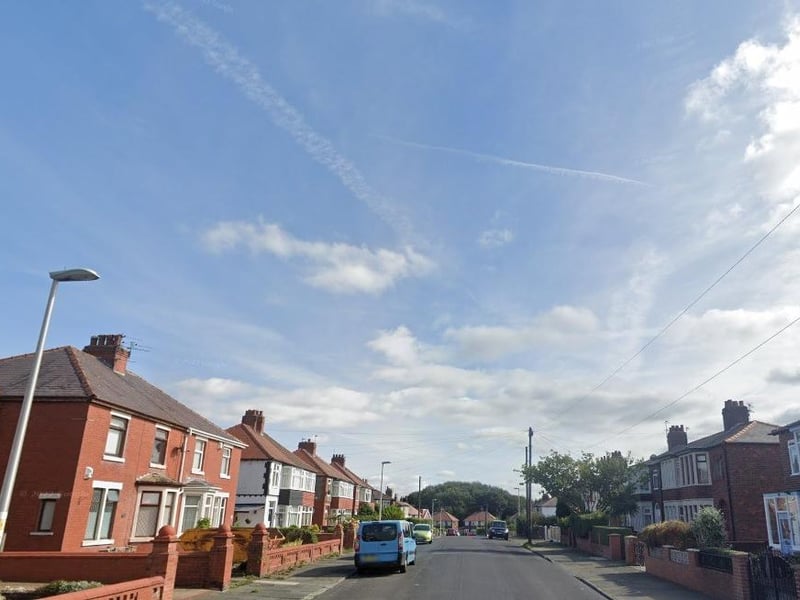
8. Warbreck & Bispham Road
In the Warbreck & Bispham Road area, there were 351. ASB reports per 1,000 residents. Photo: Google
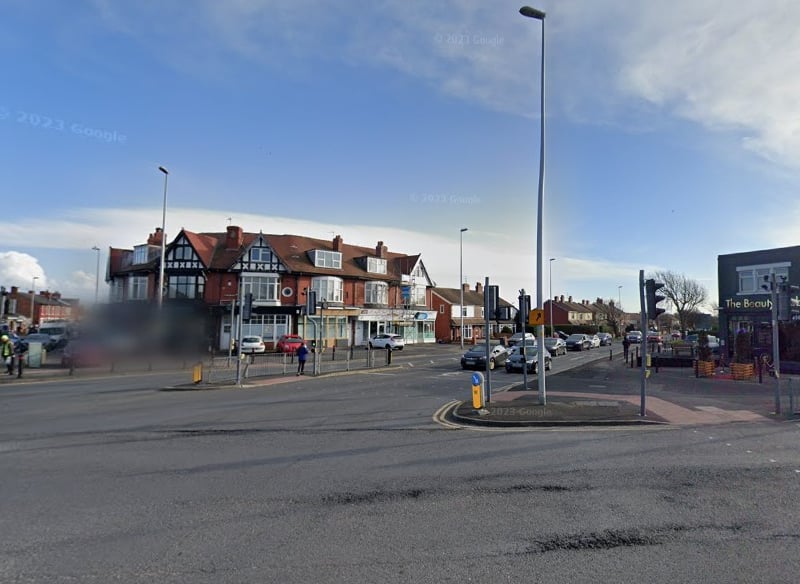
9. Victoria
In the Victoria area, there were 36.4 ASB reports per 1,000 residents. | Google
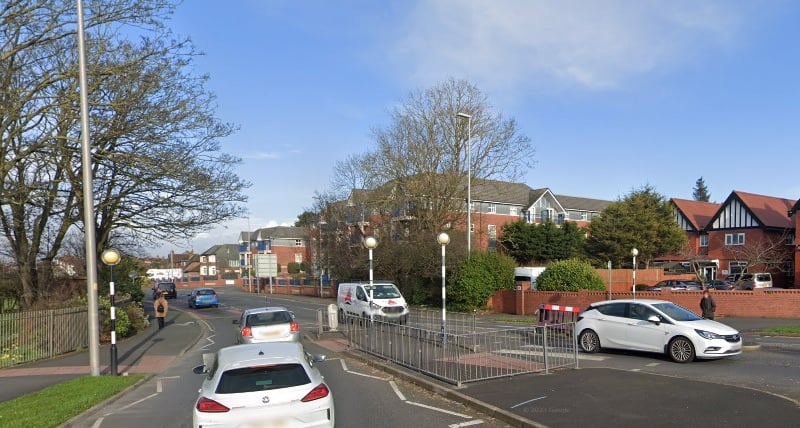
10. Queenstown & Layton
In the Queenstown & Layton area, there were 38.6 ASB reports per 1,000 residents. | Google
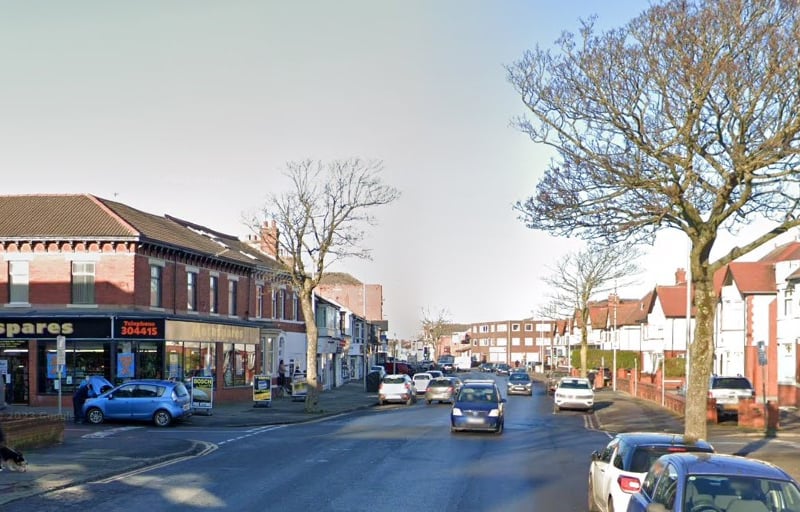
11. Park Road
In the Park Road area, there were 41.1 ASB reports per 1,000 residents. | Google
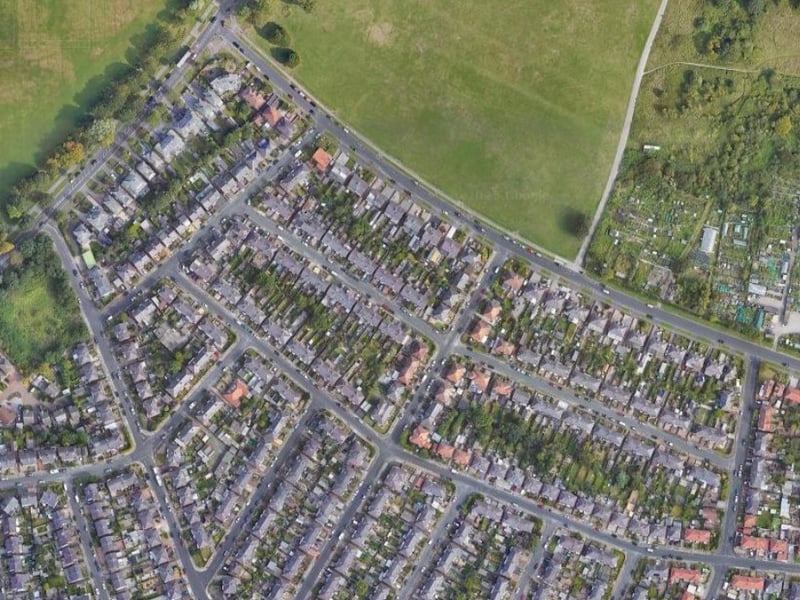
12. Stanley Park & Great Marton
In the Stanley Park & Great Marton area, there were 45.5 ASB reports per 1,000 residents. | Google