
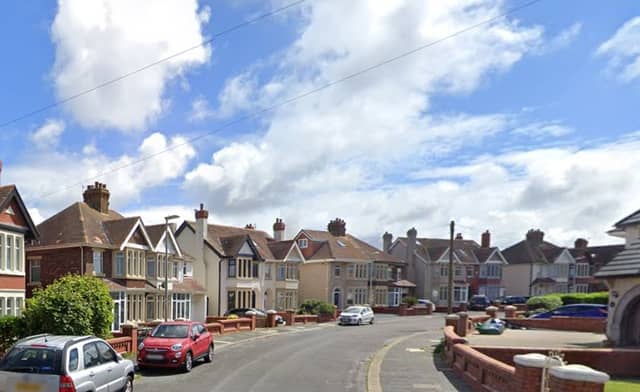


We have ranked all of Blackpool’s neighbourhoods by burglary rates, revealing the areas most affected by burglaries.
The Police UK figures use Lancashire Constabulary’s official crime numbers, which break down criminal offences reported in the city into specific areas.
While no area is free from crime and recorded figures do not capture every offence, the data provides a snapshot of where reported burglaries were most concentrated relative to population size.
Sign up for our Blackpool Gazette retro newsletter - warm nostalgia delivered to your inbox - weekly.
Blackpool is split into 19 Middle Layer Super Output Areas (MSOAs) - or neighbourhoods - and the figures refer to where the crimes occurred, not where they were reported from.
The data is for the period from December 2024 to November 2025 with the rankings based on the number of recorded offences per 1,000 residents in each neighbourhood. For context, the national average is 8.6.
We have ranked all 19 neighbourhoods in Blackpool from lowest to highest overall recorded burglaries.
All photos are for illustrative purposes only and the data does not refer to any individual buildings or streets.
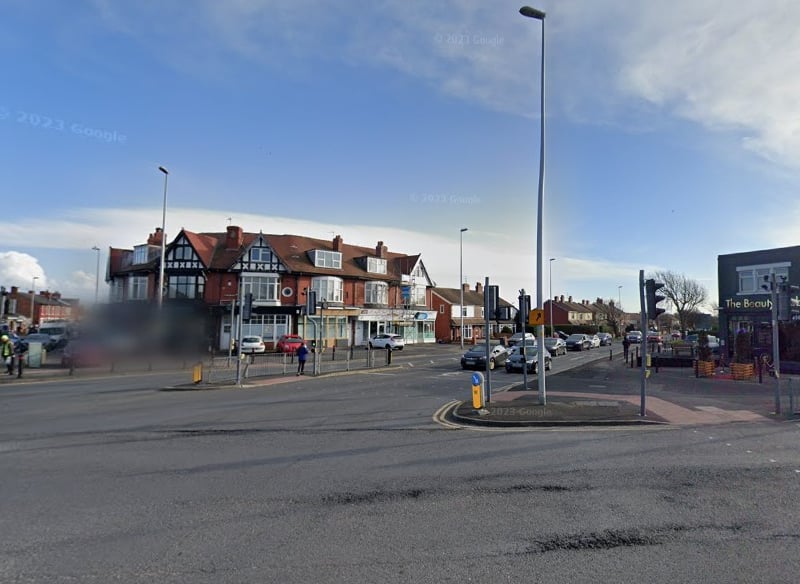
13. Victoria
In the Victoria area, there were 10.5 burglaries per 1,000 residents. | Google
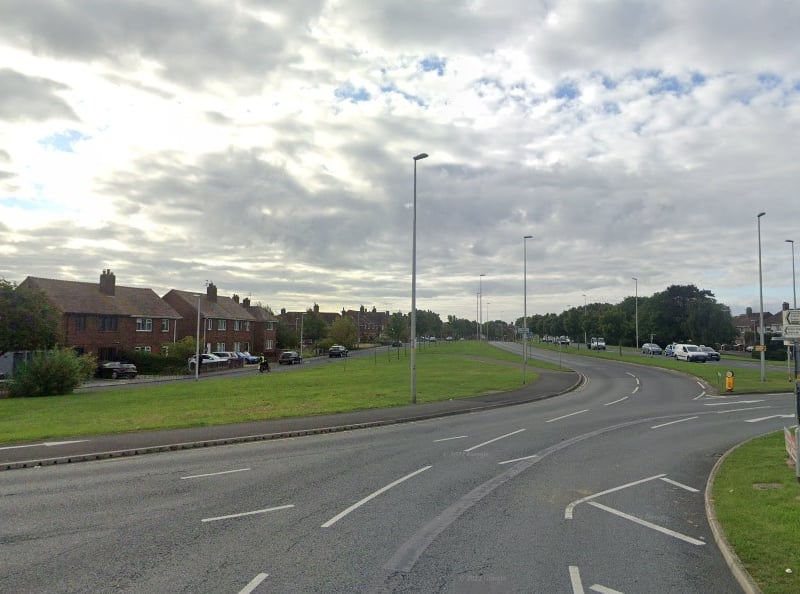
14. Little Layton & Little Carleton
In the Little Layton & Little Carleton area, there were 12.1 burglaries per 1,000 residents. | Google
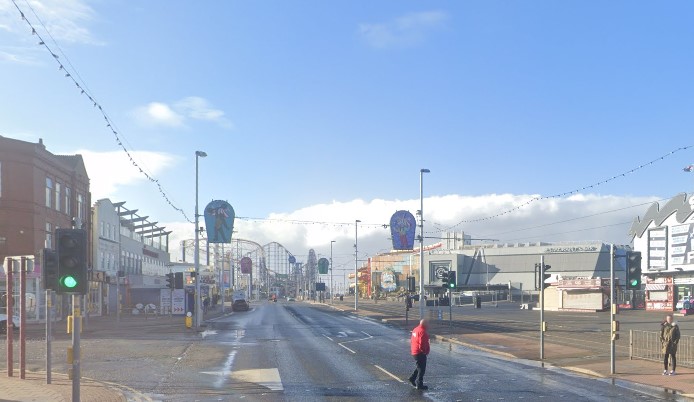
15. South Shore
In the South Shore area, there were 12.6 burglaries per 1,000 residents. | Google
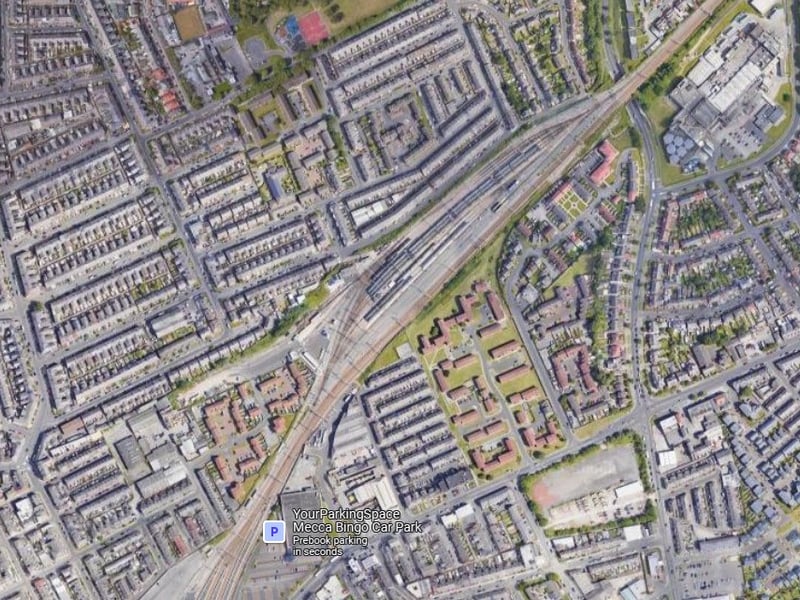
16. North East Centre
In the North East Centre area, there were 13.5 burglaries per 1,000 residents. | Google
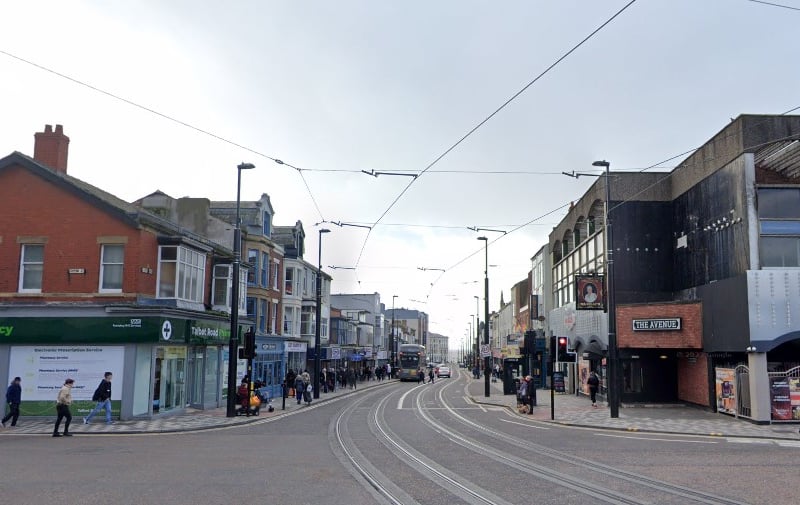
17. North Shore
In the North Shore area, there were 27.6 burglaries per 1,000 residents. | Google
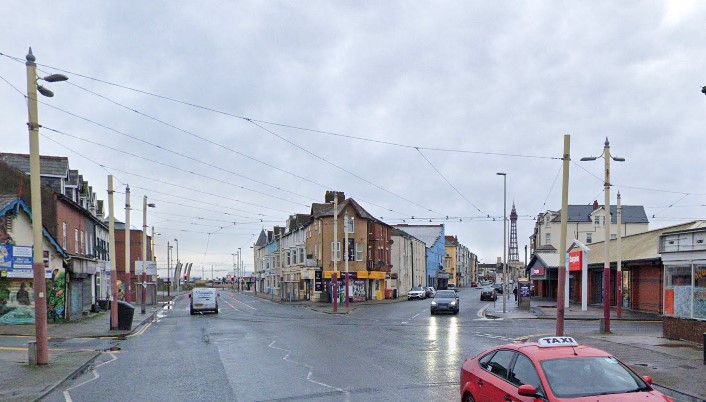
18. South Promenade & Seasiders Way
In the South Promenade & Seasiders Way area, there were 46.9 burglaries per 1,000 residents. | Google