
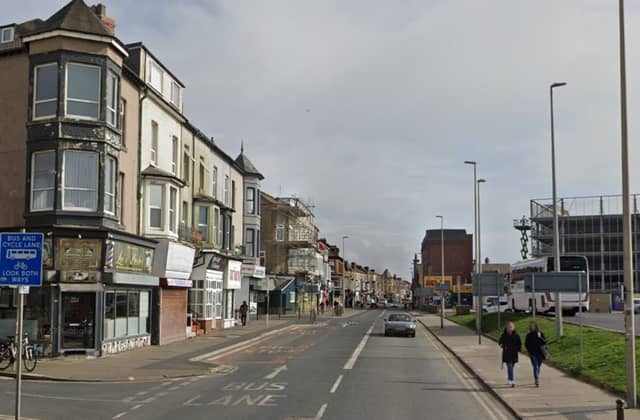


We have ranked Blackpool’s neighbourhoods by overall reported crime rates, highlighting the safest and most crime-prone areas according to police data.
The figures are provided by Police UK using Lancashire Constabulary’s crime numbers, which break down criminal offences reported in the city into specific areas.
Blackpool is split into 19 Middle Layer Super Output Areas (MSOAs) - or neighbourhoods - and the figures refer to where the crimes occurred, not where they were reported from.
The data is for the period from December 2024 to November 2025 with the rankings based on the number of reported criminal offences per 1,000 residents in each neighbourhood.
We have ranked all 19 neighbourhoods in Blackpool, from highest to lowest overall reported crime rates.
All photos are for illustrative purposes only and the data does not refer to any individual buildings or streets.
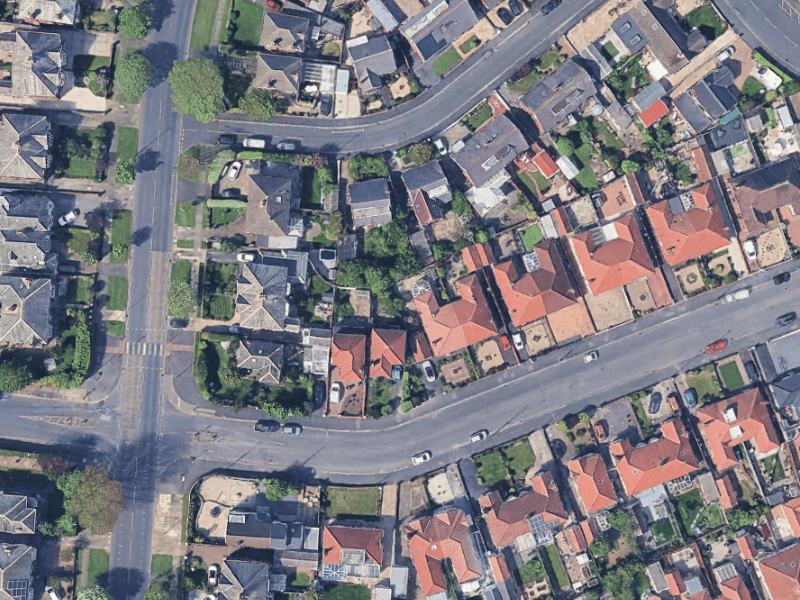
13. Churchtown
In the Churchtown area, there were were 115.7 reported crimes per 1,000 residents. | Google Earth
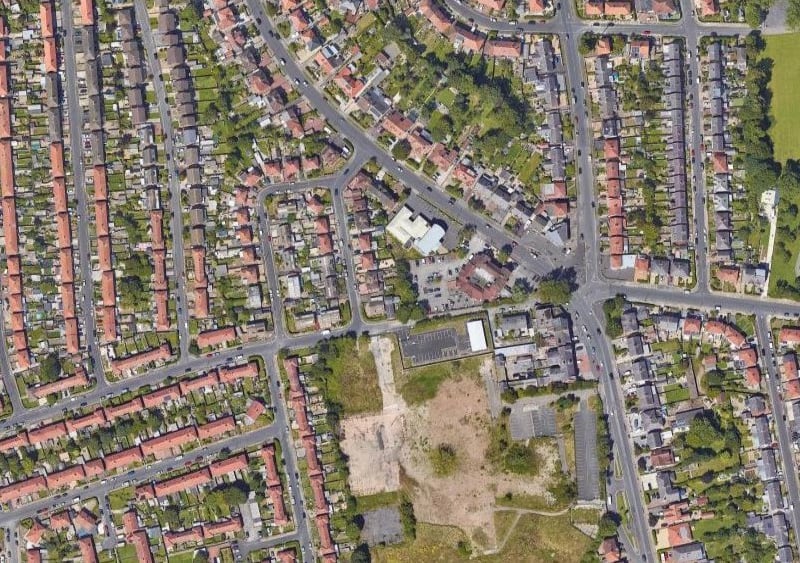
14. Warbreck & Bispham Road
In the Warbreck & Bispham Road area, there were were 111.6 reported crimes per 1,000 residents. | Google
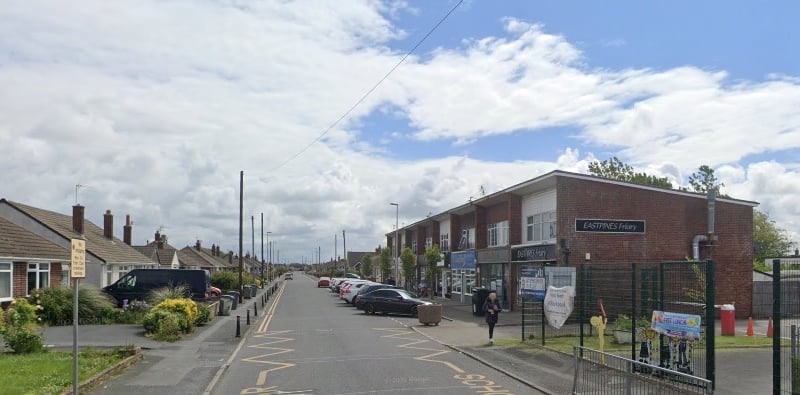
15. Little Bispham & Anchorsholme
In the Little Bispham & Anchorsholme area, there were were 86.8 reported crimes per 1,000 residents. | Google
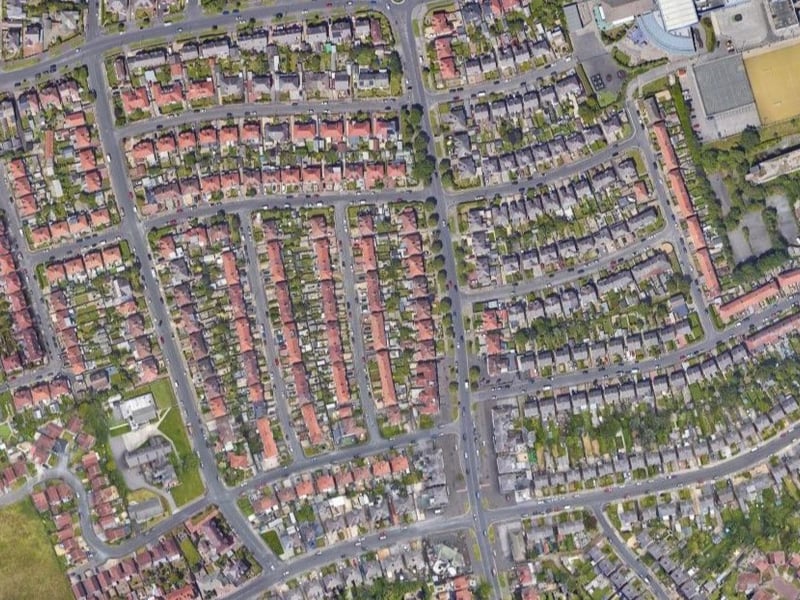
16. Hoohill
In the Hoohill area, there were were 82.4 reported crimes per 1,000 residents. | Google
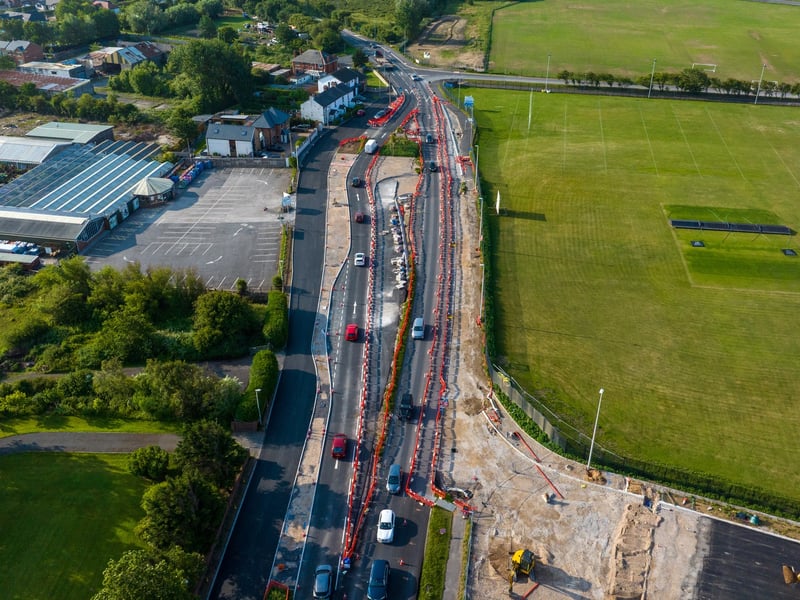
17. Common Edge
In the Common Edge area, there were were 79.4 reported crimes per 1,000 residents. | Blackpool Council
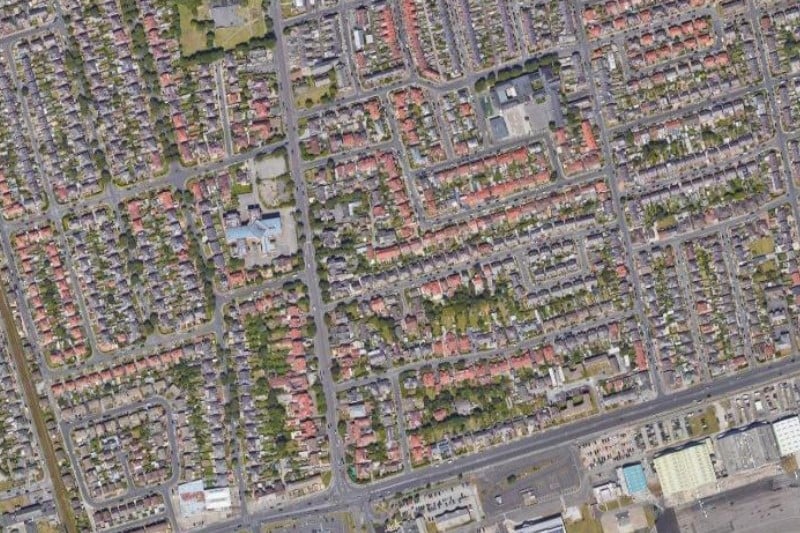
18. Squires Gate
In the Squires Gate area, there were were 77.9 reported crimes per 1,000 residents. | Google