



Buckshaw Village based security service firm Churchill Support Services have used official statistics to explore the most dangerous areas of their home county of Lancashire, finding hotspots and discovering which crimes are the most prevalent.
Across 2023, the data shows that there were 133,786 offences across the county, with 2 in every 5 offences being a violent crime (54,090 offences).
Churchill say they also discovered “equally concerning” figures in theft (38,333 incidents), criminal damage (14,776 incidents) and public order offences (7,887 incidents), all of which are at high levels when compared to other regions across the North West, and the UK as a whole.
But between the different areas of Lancashire, crime levels do differ, as does the make-up of which offences are most common, so Churchill have now released a list of the 25 most dangerous areas in Lancashire and named their most common offences.
How were the most dangerous places in Lancashire decided?
Churchill sourced their figures from the official Police UK website, and coupled these with official data from the Office of National Statistics on population and area size.
They then represent the amount of crime in any given area as a ratio of the number of crimes per 1,000 residents, as this takes into account key variables like population and ensures that the data is easier to compare.
Where are the 25 most dangerous places?
Take a look at the below picture gallery which lists the 25 most dangerous places in Lancashire in ascending order.
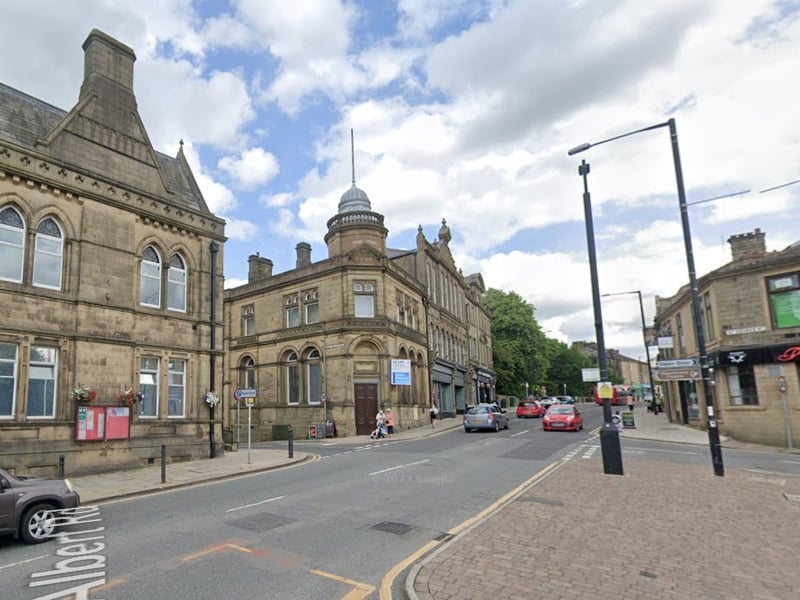
19. Colne
The latest crime rate is 135.4 crimes per 1,000 residents, and this includes 858 violent crime offences, 721 antisocial behaviour and 192 shoplifting offences. | Google Maps
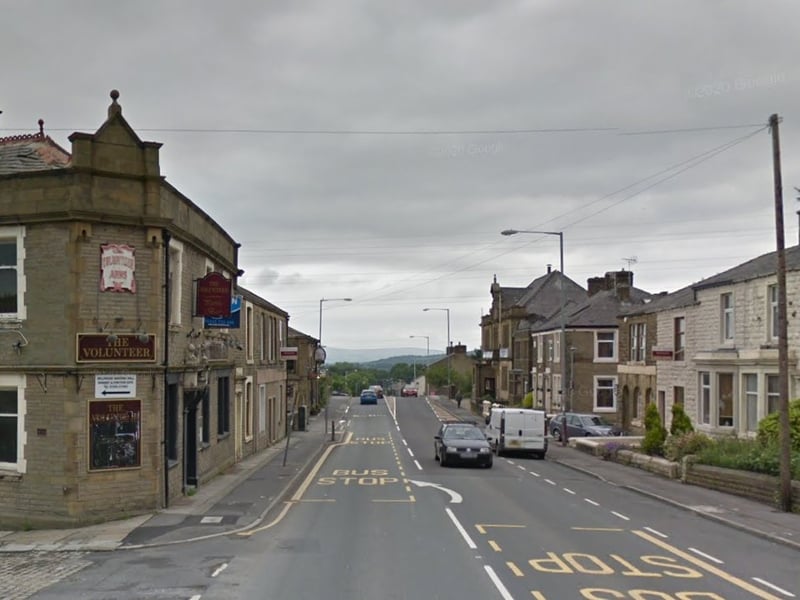
20. Clayton-le-Moors & Altham
The latest crime rate is 137.7 crimes per 1,000 residents, and this includes 405 violent crime offences, 292 antisocial behaviour and 104 criminal damage offences. | Google Maps
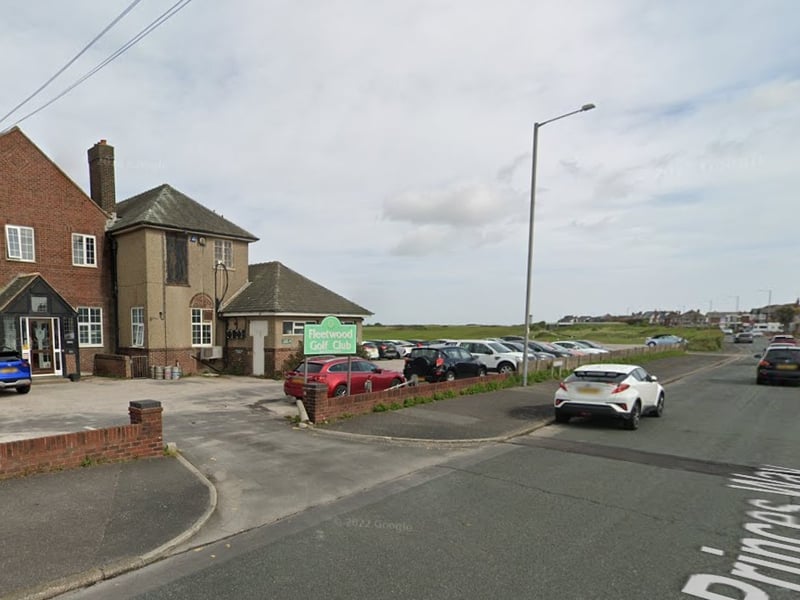
21. Fleetwood
The latest crime rate is 138 crimes per 1,000 residents, and this includes 1,135 violent crime offences, 1,069 antisocial behaviour and 263 shoplifting offences. | Google Maps
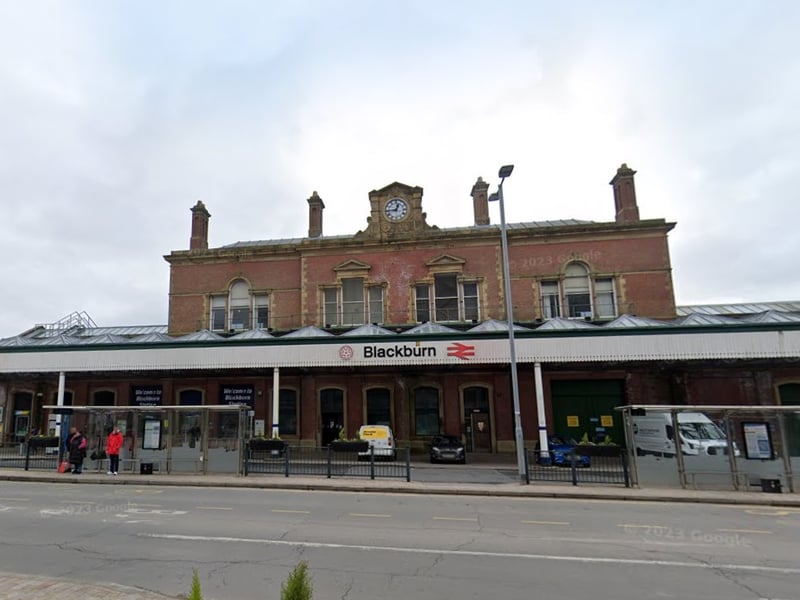
22. Blackburn
The latest crime rate is 139.2 crimes per 1,000 residents, and this includes 5,777 violent crime offences, 4,386 theft offences, 1,419 antisocial behaviour and 1,063 vehicle crime shoplifting offences. | Google Maps
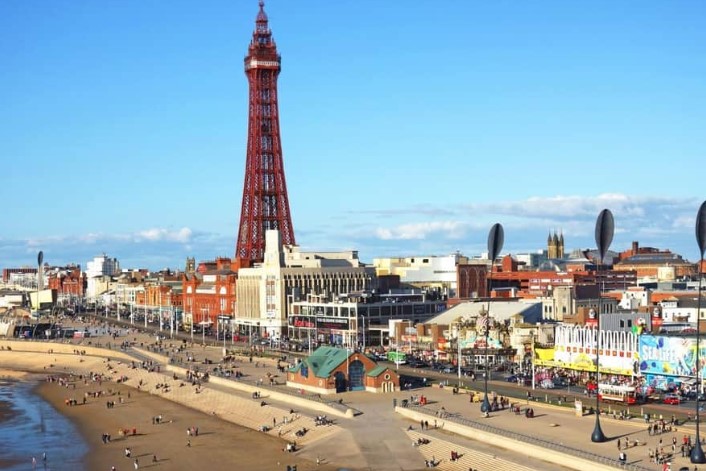
23. Blackpool
The latest crime rate is 139.2 crimes per 1,000 residents, and this includes 6,530 violent crime offences, 5,665 antisocial behaviour,1,439 criminal damage offences and 1,451 shopfliting offences. | Google Maps
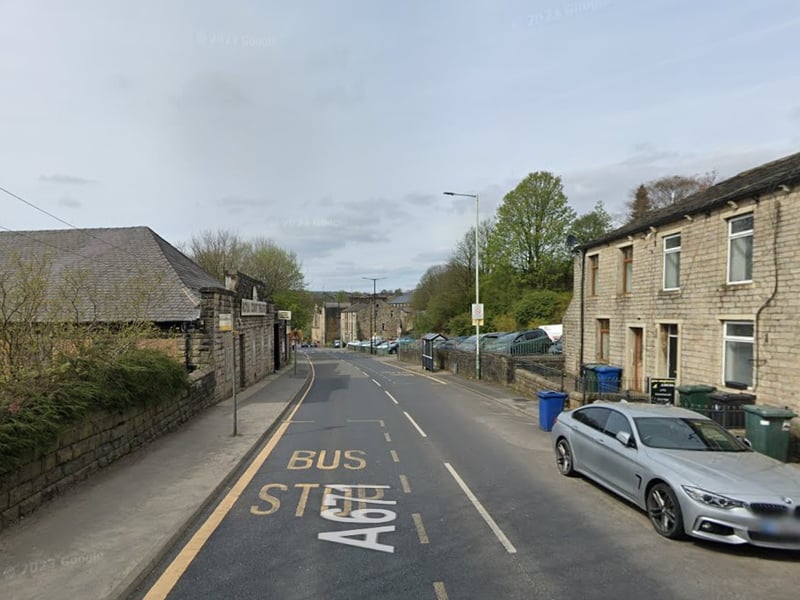
24. Bacup
The latest crime rate is 139.6 crimes per 1,000 residents, and this includes 693 antisocial behaviour, 647 violent crime offences and 200 criminal damage offences. | Google Maps