

The figures are based on the total number of recorded shoplifting offences per 1,000 residents over a 12-month period.
The national average for shoplifting currently stands at 7.7 offences per 1,000 people.
Every area listed below recorded rates well above that figure, with some neighbourhoods reporting levels many times higher.
The rankings use police-recorded crime data covering the 12 months from September 2024 to August 2025, sourced from Police UK.
Incidents are mapped to where they occurred and assigned to small neighbourhood areas used for official statistics.
Each area name is followed by a short code, such as Blackpool 010D or Fylde 006C.
These are Lower Super Output Area (LSOA) codes, which divide towns and districts into neighbourhoods of around 1,000 to 3,000 residents, helping police compare crime levels more accurately.
While no area is free from crime and recorded figures do not capture every offence, the data provides a snapshot of where shoplifting offences are most concentrated relative to population size:
Join our new WhatsApp Community to get the latest news and top stories from across Lancashire directly to your phone
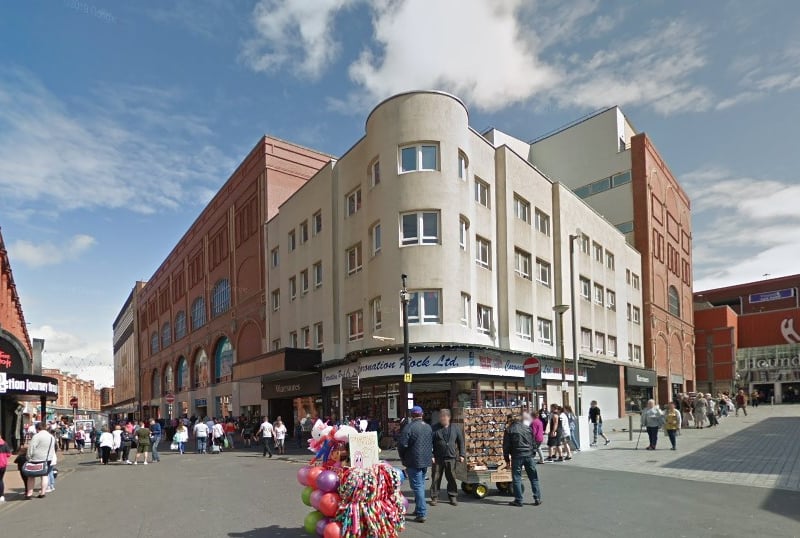
1. Central Blackpool – Blackpool 010D
The area recorded 154.1 shoplifting incidents per 1,000 residents over the past 12 months. | Google
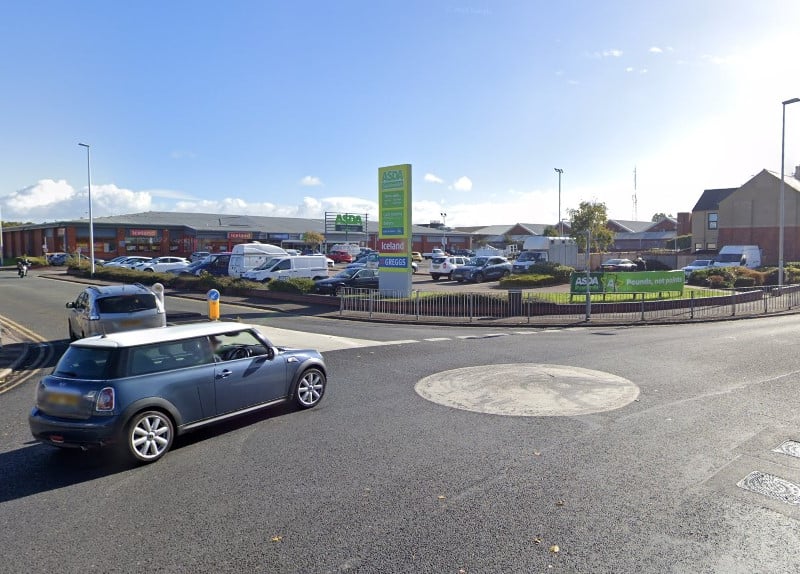
2. Hawes Side - Blackpool 016A
The area recorded 103.3 shoplifting incidents per 1,000 residents over the past 12 months. | Google
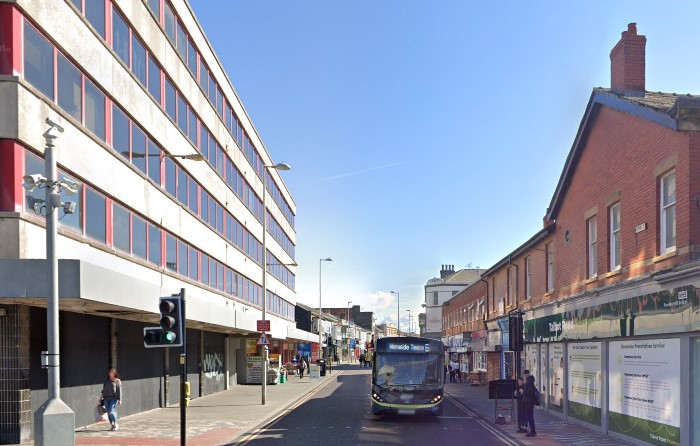
3. Central Blackpool – Blackpool 010E
The area recorded 99.7 shoplifting incidents per 1,000 residents over the past 12 months. | Google
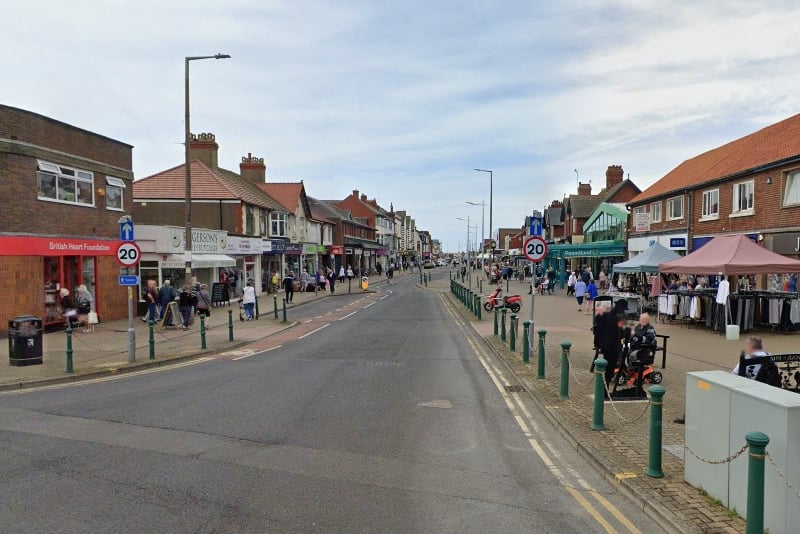
4. Cleveleys West - Wyre 008C
The area recorded 90.4 shoplifting incidents per 1,000 residents over the past 12 months. | Google
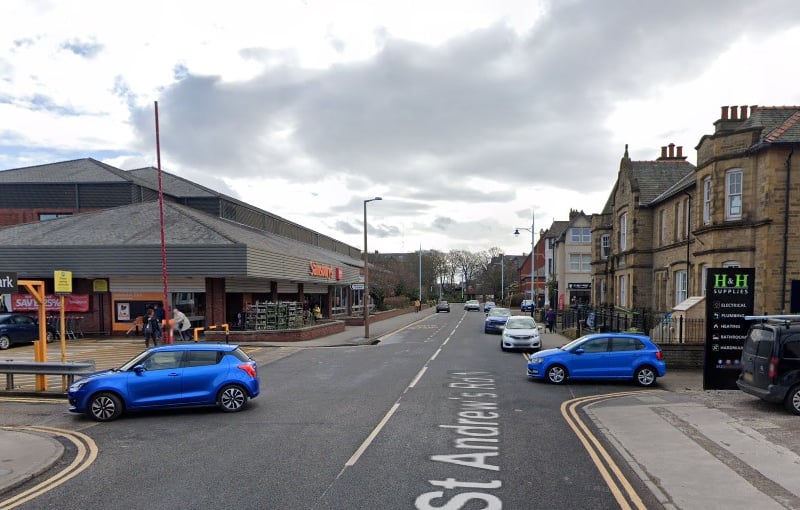
5. St Annes Town - Fylde 006C
The area recorded 82.7 shoplifting incidents per 1,000 residents over the past 12 months. | Google
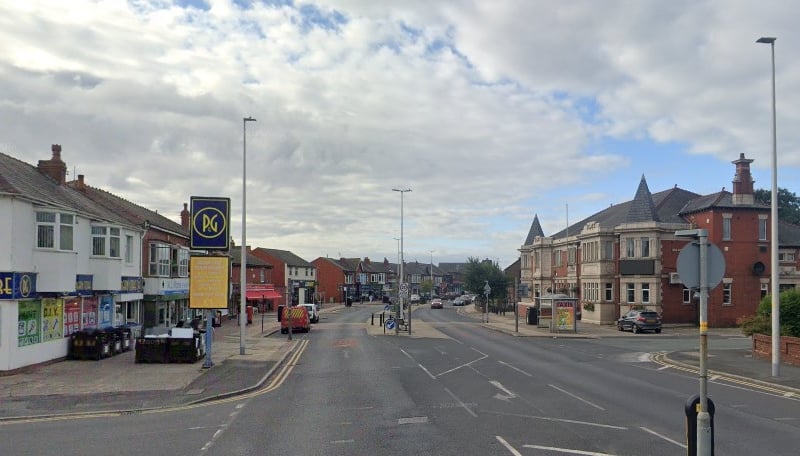
6. Little Layton and Little Carleton - Blackpool 007A
The area recorded 60.4 shoplifting incidents per 1,000 residents over the past 12 months. | Google