
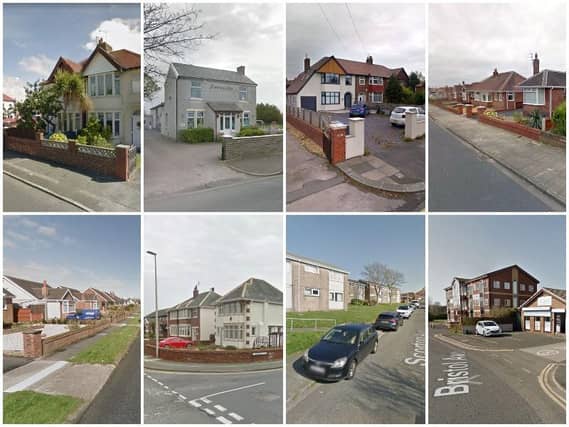

Data has been collected from the Index of Multiple Deprivation (IMD) which was most recently updated in September 2019.
The IMD is the official measure of deprivation in England. The IMD combines information about seven different types of deprivation to produce an overall relative measure of deprivation. In the IMD 2019, there are 39 datasets (indicators) organised into the seven domains of deprivation.
The IMD measures deprivation for small areas named Lower Super Output Areas (LSOAs). Each LSOA is estimated to contain around 650 households and can span over a few geographically close streets. LSOAs do not correspond exactly to postcodes, so the postcodes and street names given in this article are approximate.
The following 12 are the least deprived LSOAs in Blackpool. They have also been ranked according to their deprivation ranking in Blackpool, beginning with the least deprived.
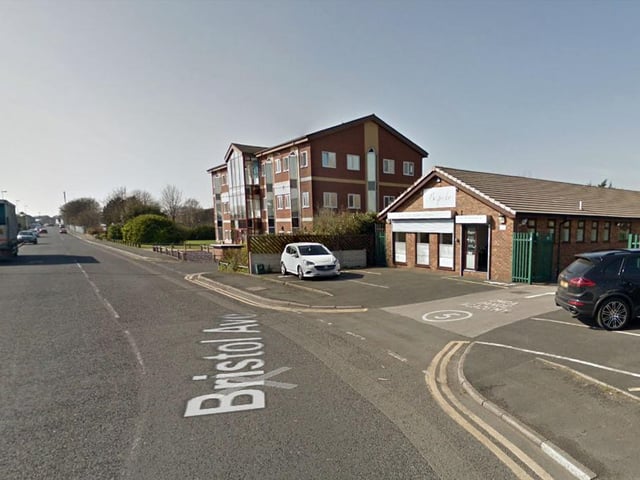
8. FY2 0BF
Including Bristol Avenue, Ingleton Avenue, Moor Park Avenue, Pinewood Avenue | other Photo: Google
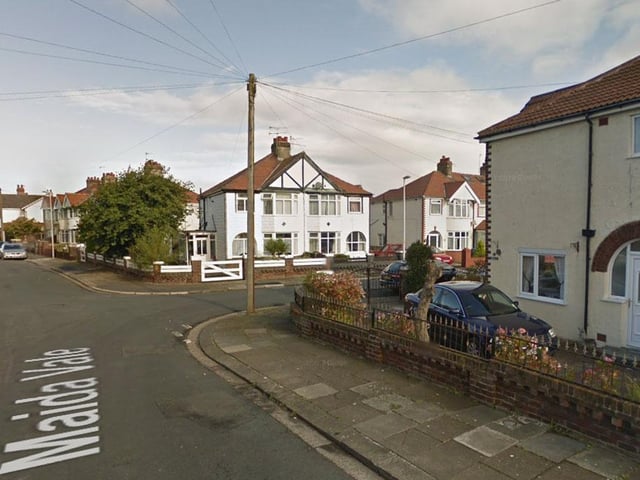
9. FY5 1, FY5 3,
Including Maplewood Drive, Winsford Crescent, Melton Place, Woodridge Avenue, Norbreck Road, Maida Vale, Lyddesdale Avenue, Lockerbie Avenue, Valeway Avenue and Jem Gate | other Photo: Google
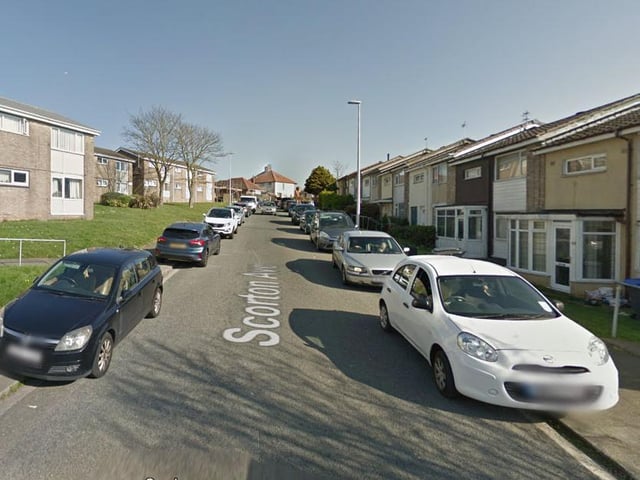
10. FY3 7EJ
Including Beckway Avenue, Grange Road, Lakeway, Scorton Avenue, St Bernard Avenue, St Louis Avenue and St Walburga's Road (A587) | other Photo: Google
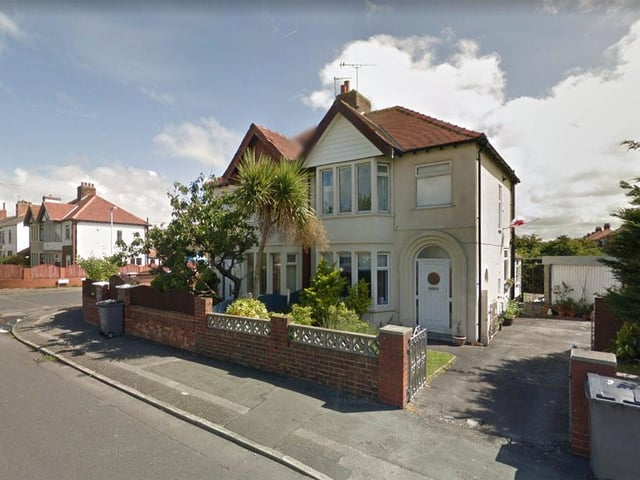
11. FY4 2FH
Including Abbey Close, Abbey Road, Abbeyville, Belvere Avenue, Boome Street, Cheddar Avenue, Colville Avenue, Garton Avenue, Gildabrook Road Primrose Avenue and Ravenwood Avenue | other Photo: Google
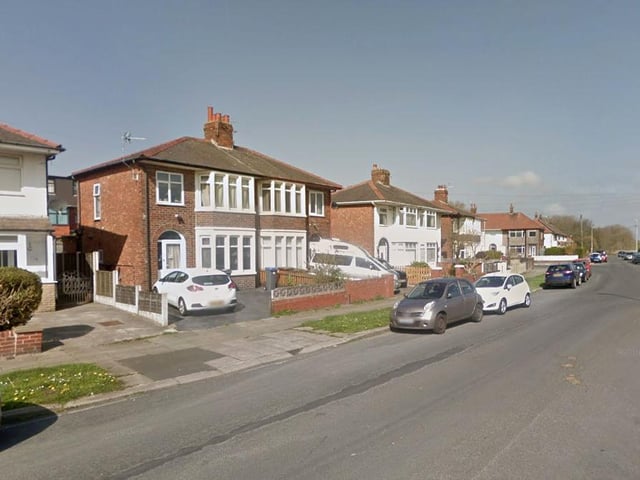
12. FY2 0QN
Including Broderick Avenue, Chelsea Mews, Holyoake Avenue, Hughes Grove, Maurice Grove, Plymouth Road (A587) | other Photo: Google