But despite that, average house prices held up across England – even if there was a drop in sales.
It was the same picture in Blackpool, where prices rose by 2.3% in the year to September 2020. Across the North West, prices rose by 2.5%.
The ONS also publishes house price figures by Middle Layer Super Output Areas (MSOAs) – small geographic areas containing an average of 7,200 people.
These show 13 of the 19 MSOAs that make up Blackpool saw a rise in house prices over the same period.
Here we reveal which neighbourhoods saw the strongest growth in the year to September 2020.
1.
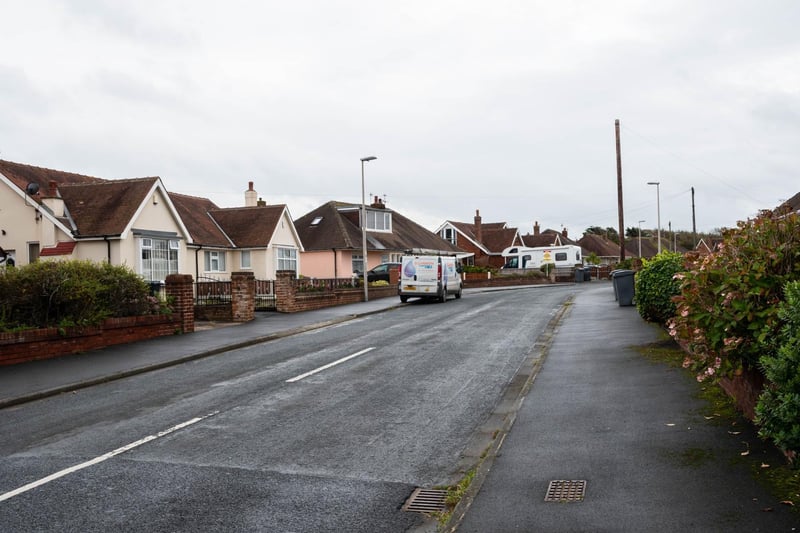
In Little Bispham & Anchorsholme the average price rose to £133,031, up by 1.2% on the year to September 2019. Overall, 127 houses changed hands here between October 2019 and September 2020, a drop of 17%.
2. Central Blackpool
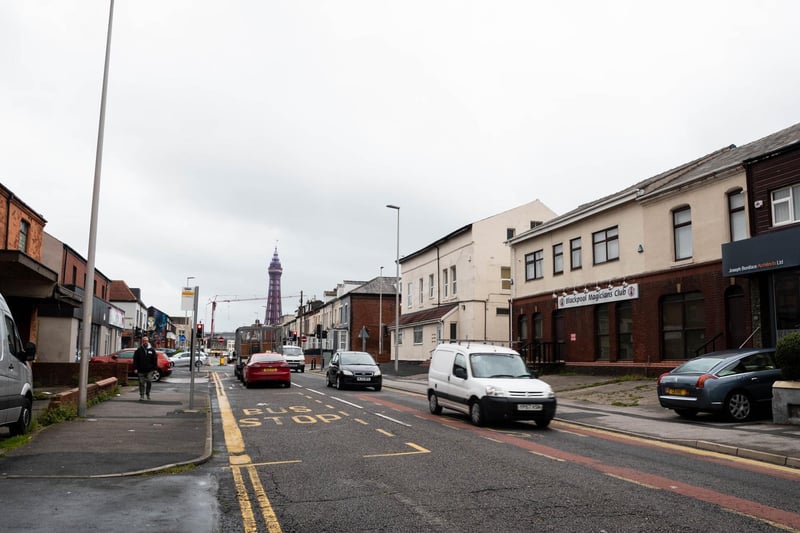
In Central Blackpool the average price rose to £82,296, up by 2% on the year to September 2019. Overall, 37 houses changed hands here between October 2019 and September 2020, a drop of 18%.
3. Norbreck & Bispham
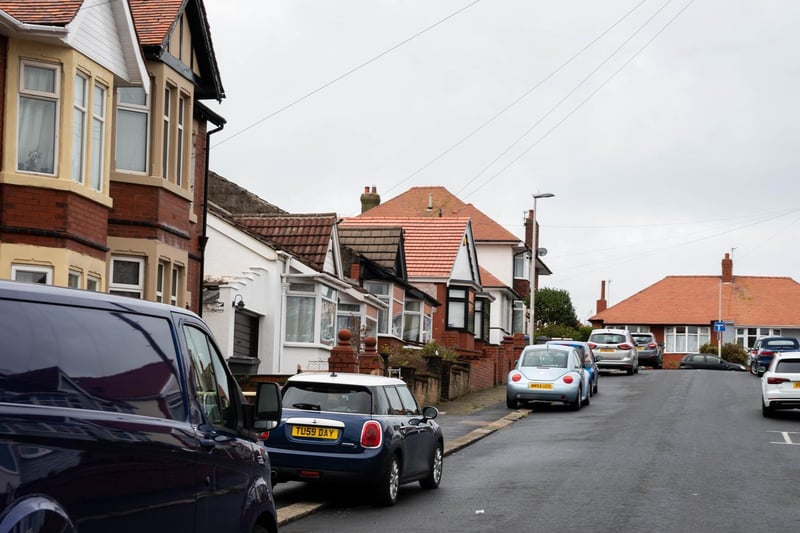
In Norbreck & Bispham the average price rose to £142,837, up by 2.5% on the year to September 2019. Overall, 117 houses changed hands here between October 2019 and September 2020, a drop/rise of 27%.
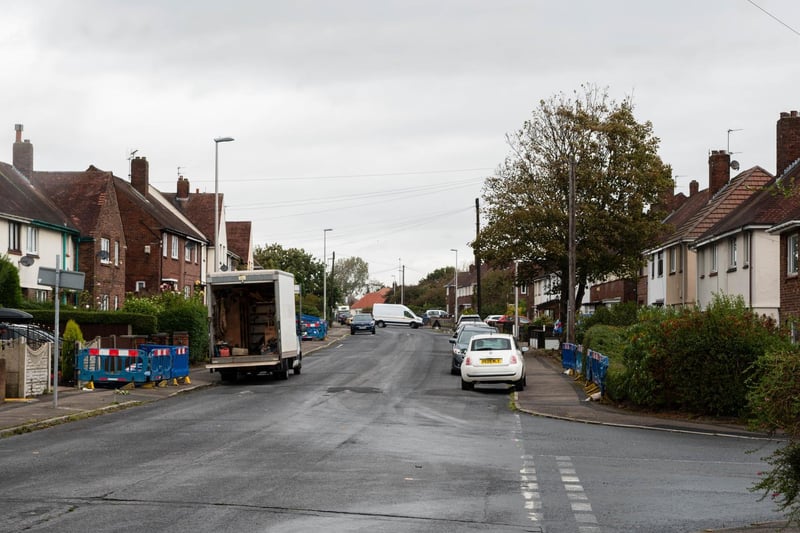
4. Little Layton & Little Carleton
In Little Layton & Little Carleton the average price rose to £90,823, up by 3% on the year to September 2019. Overall, 28 houses changed hands here between October 2019 and September 2020, a drop of 40%.
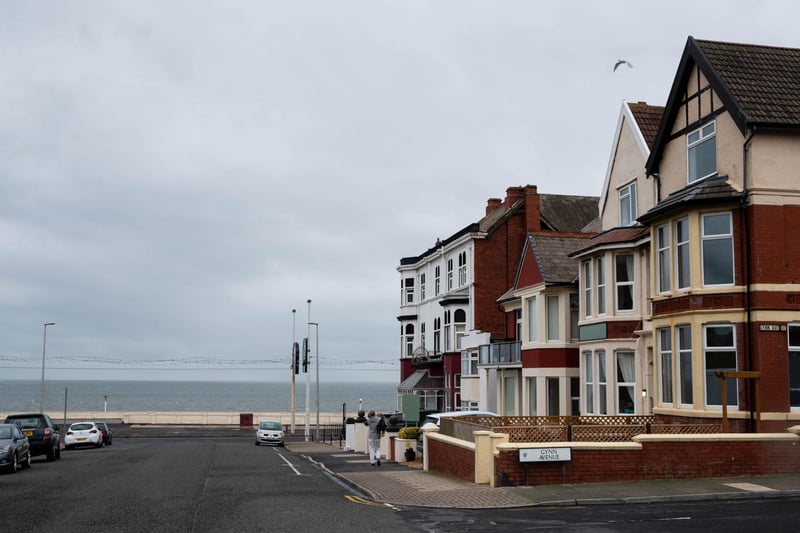
5. North Shore
In North Shore the average price rose to £110,118, up by 3.6% on the year to September 2019. Overall, 40 houses changed hands here between October 2019 and September 2020, a drop of 51%.
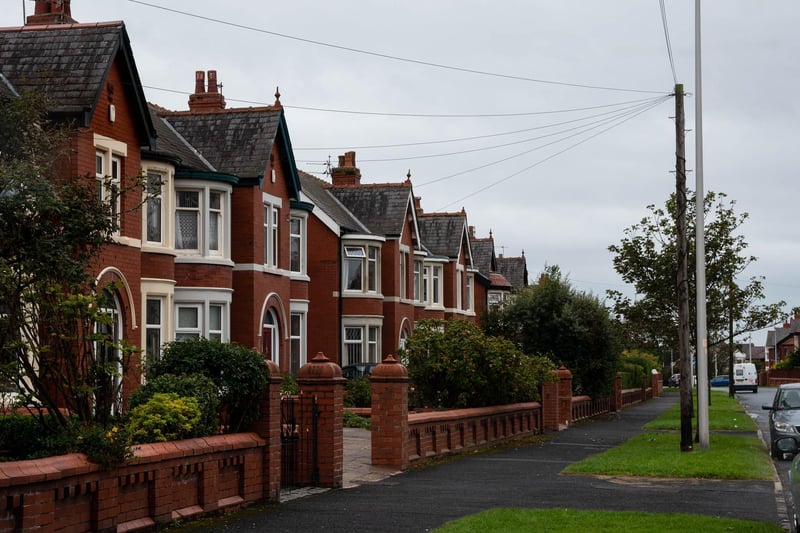
6. Hoohill
In Hoohill the average price rose to £132,290, up by 3.7% on the year to September 2019. Overall, 90 houses changed hands here between October 2019 and September 2020, a drop of 20%.
