
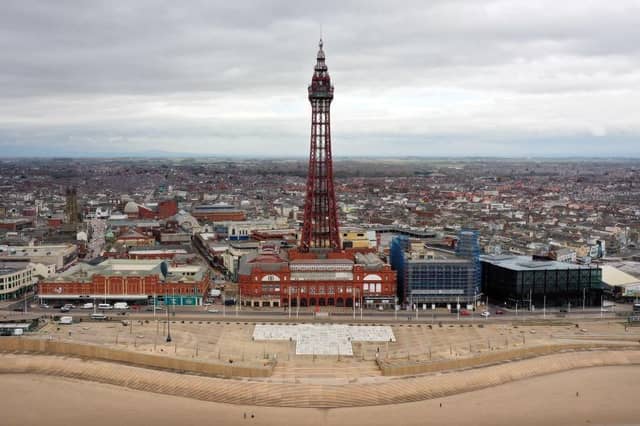

New rules introduced on Tuesday (November 30), mean that masks must be worn in shops and on public transport to help prevent the spread of the Omicron variant.
In Blackpool 13 areas have seen a rise in cases, while 5 neighbourhoods have seen cases fall in the seven days to November 25, 2021.
Pictures used are for illustrative purposes only and not directly linked to the data.
Here are the latest Covid picture for each neighbourhoods in Blackpool:
Want to see fewer ads? Subscribers to The Gazette get access to the ad-lite version of our website, which features 70% fewer ads and faster load times for a better experience. Find out more
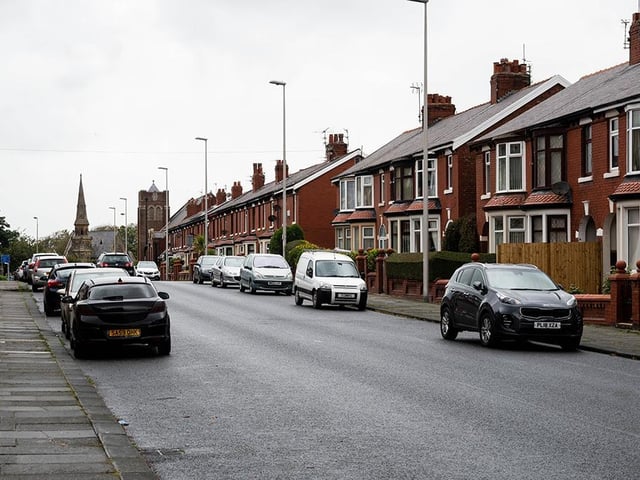
13. Queenstown & Layton
Queenstown & Layton had a rate of 327.9 Covid-19 cases per 100,000 people in the latest week, a rise of 4.0% from the week before.
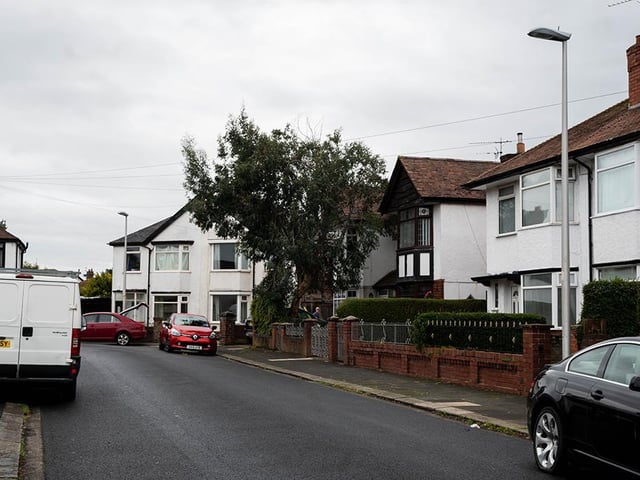
14. Warbreck & Bispham Road
Warbreck & Bispham Road had a rate of 405.5 Covid-19 cases per 100,000 people in the latest week, the same as the week before.
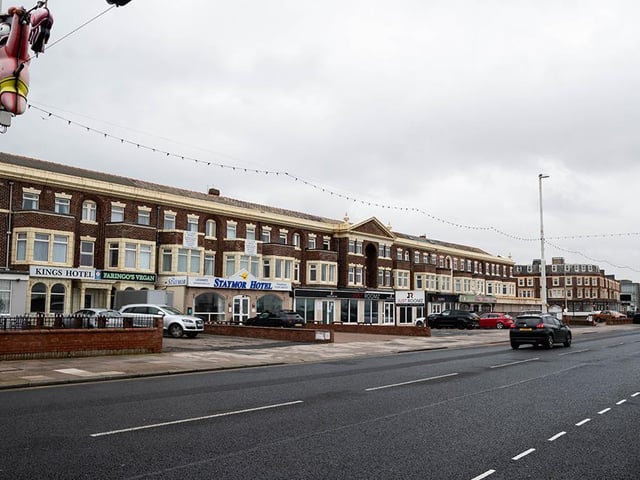
15. South Shore
South Shore had a rate of 410.3 Covid-19 cases per 100,000 people in the latest week, a fall of 5.7% from the week before.
16. Little Bispham & Anchorsholme
Little Bispham & Anchorsholme had a rate of 393.2 Covid-19 cases per 100,000 people in the latest week, a fall of 11.8% from the week before.
17. Little Layton & Little Carleton
Little Layton & Little Carleton had a rate of 376.7 Covid-19 cases per 100,000 people in the latest week, a fall of 25.8% from the week before.
18. South Promenade & Seasiders Way
South Promenade & Seasiders Way had a rate of 488.9 Covid-19 cases per 100,000 people in the latest week, a fall of 32.6% from the week before.