

There were 410,173 positive cases in the UK in the week ending 10 March, a 56% rise from the week before.
In almost all neighbourhoods in Blackpool, the number of positive cases is on the rise again. Only four areas have shown a decrease in numbers.
The figures include both positive PCR and lateral flow tests.
They include people infected with Covid-19 for the first time as well as reinfections.
At neighbourhood level, Covid-19 case rates have been published for the week to March 10.
Here are the neighbourhoods in Blackpool with the biggest rise in case rates in the past week.
Want to see fewer ads? Subscribers to The Gazette get access to the ad-lite version of our website, which features 70% fewer ads and faster load times for a better experience. Find out more
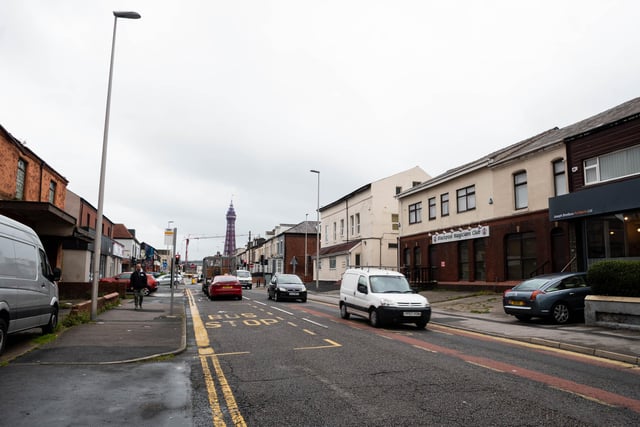
1. Central Blackpool
Central Blackpool had 770.0 Covid-19 cases per 100,000 people in the latest week, a rise of 86.2% from the week before. Photo: Kelvin Stuttard
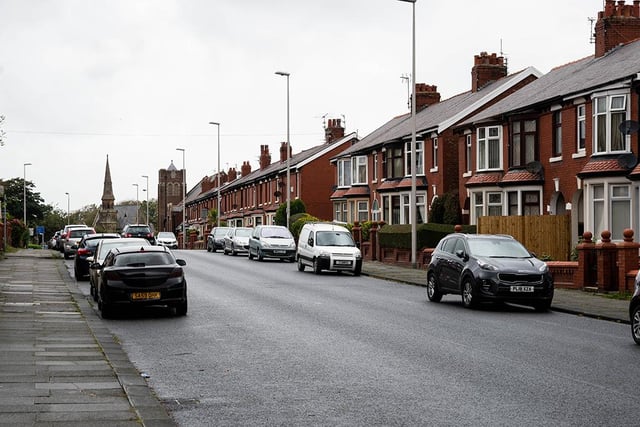
2. Queenstown & Layton
Queenstown & Layton had 1046.8 Covid-19 cases per 100,000 people in the latest week, a rise of 84.5% from the week before. Photo: Kelvin Stuttard
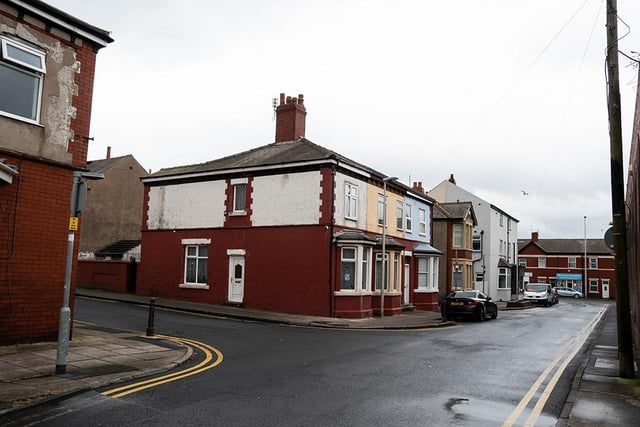
3. North East Centre
North East Centre had 887.4 Covid-19 cases per 100,000 people in the latest week, a rise of 69.4% from the week before. Photo: Kelvin Stuttard
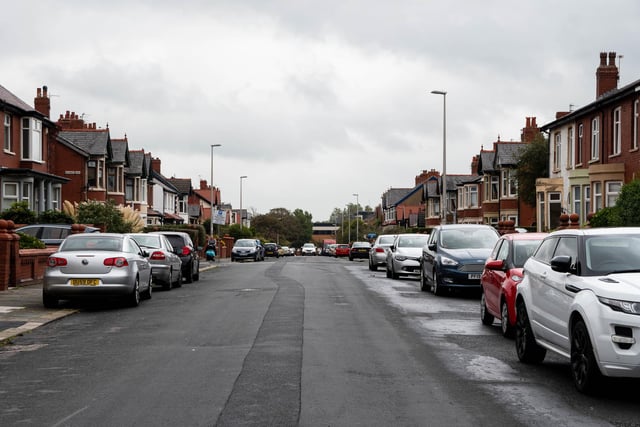
4. Park Road
Park Road had 704.0 Covid-19 cases per 100,000 people in the latest week, a rise of 47.2% from the week before. Photo: Kelvin Stuttard
5. Little Marton & Marton Moss Side
Little Marton & Marton Moss Side had 910.3 Covid-19 cases per 100,000 people in the latest week, a rise of 40.9% from the week before. Photo: Kelvin Stuttard
6. Warbreck & Bispham Road
Warbreck & Bispham Road had 946.1 Covid-19 cases per 100,000 people in the latest week, a rise of 37.5% from the week before. Photo: Kelvin Stuttard