

A review is set for Wednesday, December 16, with any changes to Tiers for any area set to be announced before being put in place from Saturday, December 19.
Ahead of the review we've looked at the latest figures from Public Health England, which show the the case rate for neighbourhoods in Blackpool for the seven days to December 9, 2020.
Seven–day rates are expressed per 100,000 population and are calculated by dividing the seven day count by the area population and multiplying by 100,000.
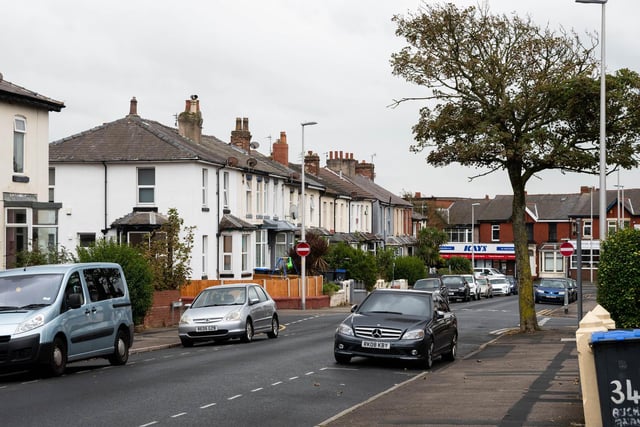
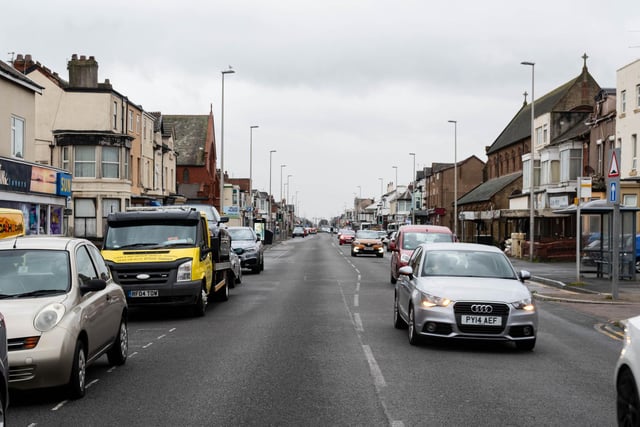
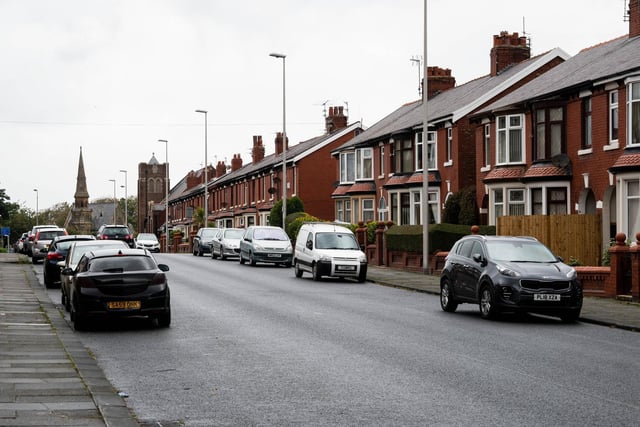
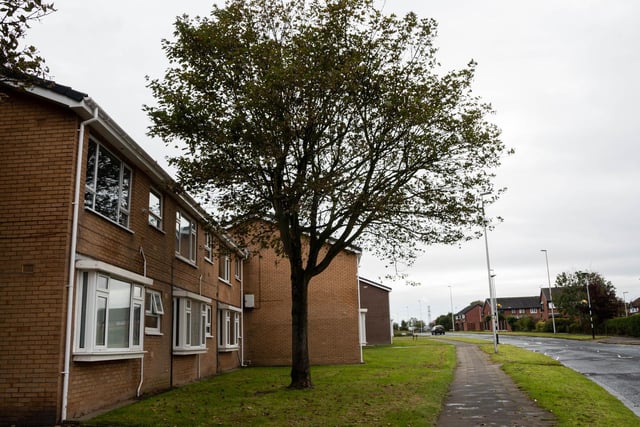
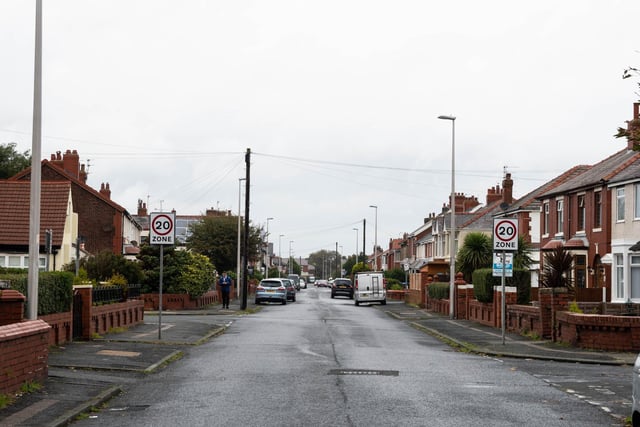
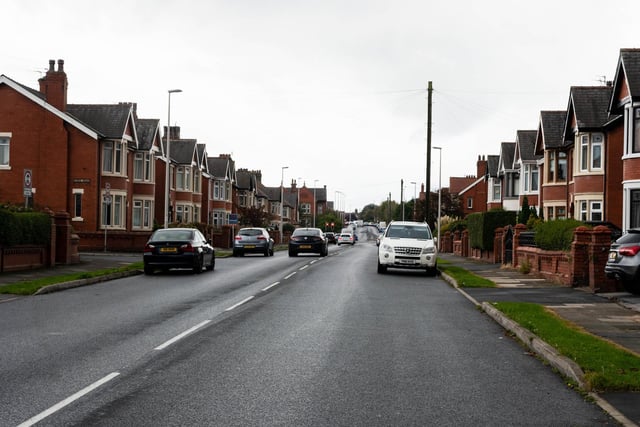
Please note that the images used for illustrative purposes only and not linked to the data..
The data below includes every area of the town, with areas that have recorded increases listed first, followed by areas where cases are falling in percentage order.
In these confusing and worrying times, local journalism is more vital than ever. Thanks to everyone who helps us ask the questions that matter by taking out a digital subscription or by buying a paper.
1. Central Blackpool - cases up 400%
There were 30 cases recorded in Central Blackpool, up 400%. The current rolling case rate is 421.4 which is above the national average.
2. South Promenade & Seasiders Way - cases up 200%
There were 6 cases recorded in South Promenade & Seasiders Way, up 200%. The current rolling case rate is 99.2 which is below the national average.
3. Queenstown & Layton - cases up 128.6%
There were 16 cases recorded in Queenstown & Layton, down 128.6%. The current rolling case rate is 197.8 which is above the national average.
4. Churchtown - cases up 116.7%
There were 13 cases recorded in Churchtown, up 116.7%. The current rolling case rate is 163.4 which is above the national average.
5. Squires Gate - cases up 66.7%
There were 4 cases recorded in Squires Gate, down 66.7%. The current rolling case rate is 50.8 which is below the national average.
6. Stanley Park & Great Marton - cases up 61.5%
There were 10 cases recorded in Stanley Park & Great Marton, down 61.5%. The current rolling case rate is 130.8 which is below the national average.