
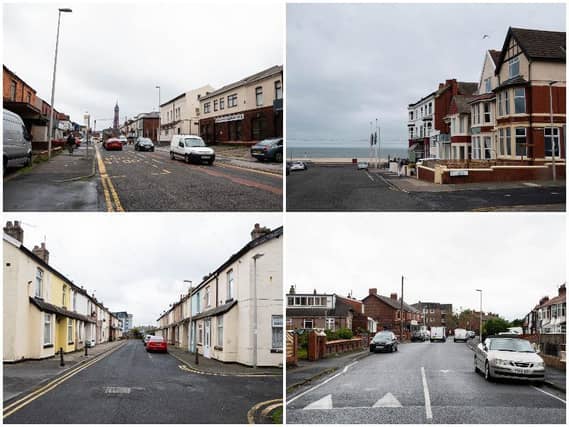
It is now more than three weeks on since the Government lifted most restrictions and limits on social contact in its roadmap out of lockdown.
The Government's interactive map shows the areas of Blackpool where the Covid rates are over 400 (burgundy), between 200-399 (dark blue) and between 100-199 (light blue), in the seven days to August 5, 2021, which is just over two weeks on from "Freedom Day", and is the latest period for which reliable figures are available.
In the seven days to August 5, 2021, 666 people had tested positive for coronavirus, a decrease of 7.4% compared to the previous seven days.
3 deaths were recorded at Blackpool Teaching Hospitals NHS Trust in the seven days to August 5, 2021.
These are the areas of Blackpool with a rate higher than 400 two weeks on from "Freedom Day" (from highest rate to lowest).
Want to see fewer ads? Subscribers to The Gazette get access to the ad-lite version of our website, which features 70% fewer ads and faster load times for a better experience. Find out more
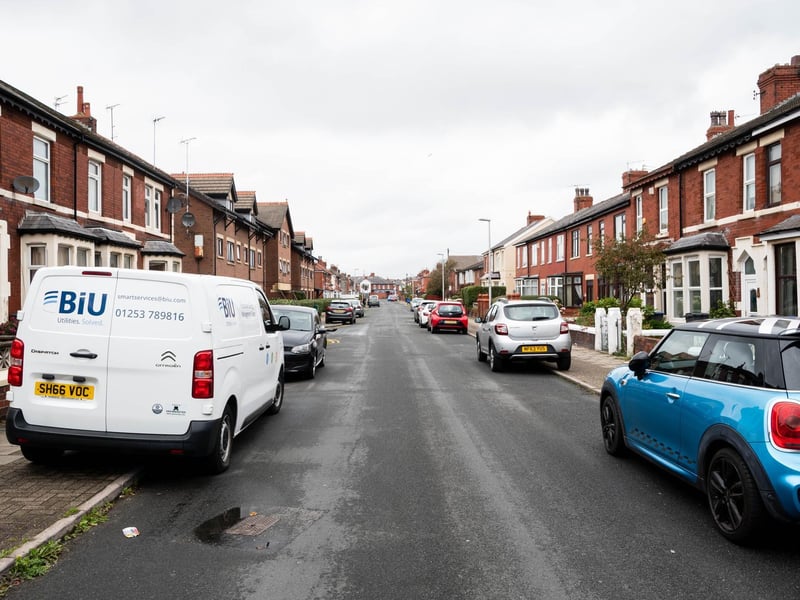
7. Victoria
With a case rate of 554.4 per 100,000 people, Victoria recorded 44 cases up by 1 (2.3%).
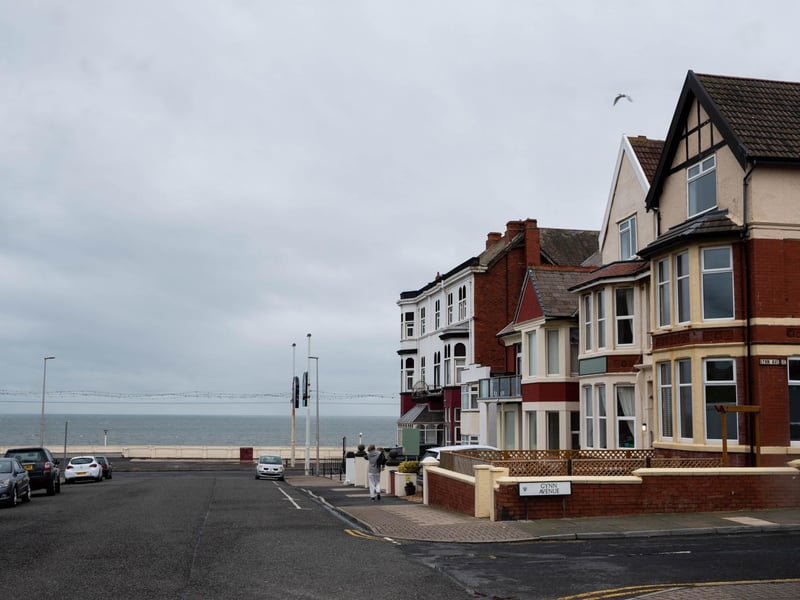
8. North Shore
With a case rate of 533.5 per 100,000 people, North Shore recorded 32 cases down by 5 (-13.5%).
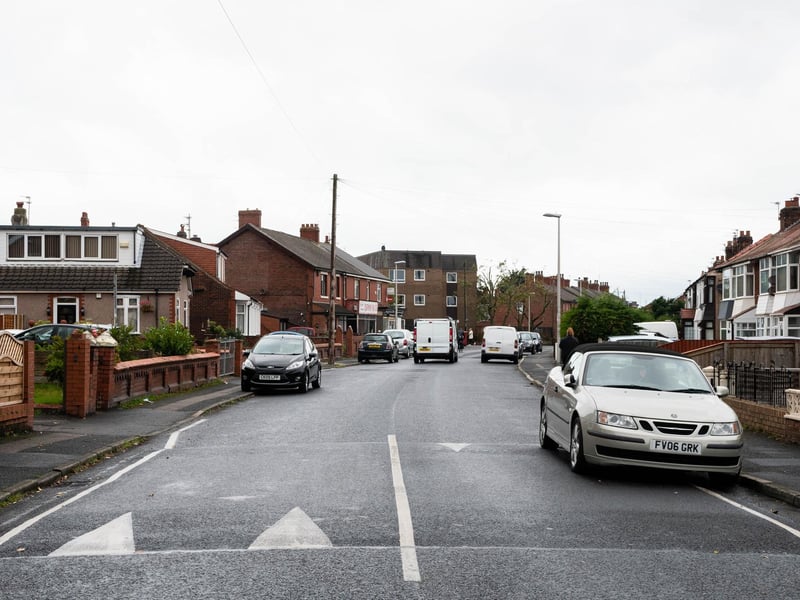
9. Hawes Side
With a case rate of 501.4 per 100,000 people, Hawes Side recorded 36 cases down up by 16 (80%).
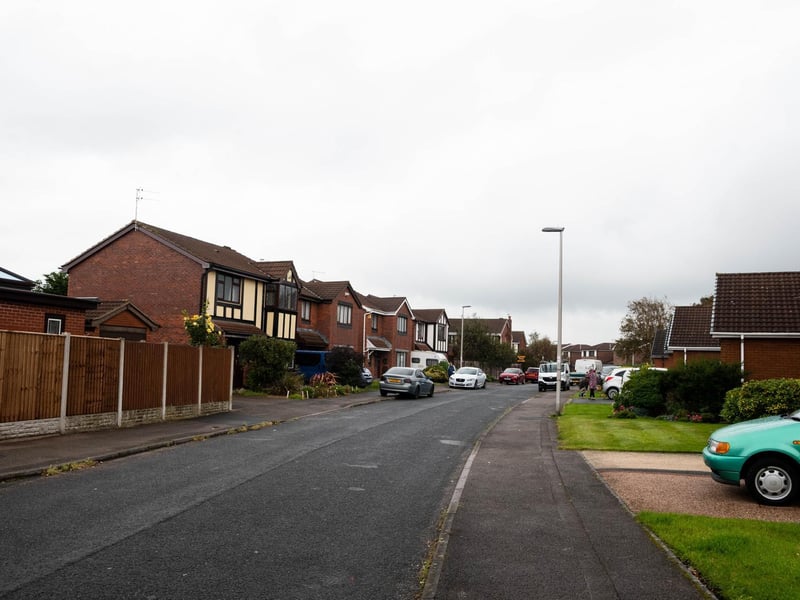
10. Common Edge
With a case rate of 433.0 per 100,000 people, Common Edge recorded 35 cases down by 4 (10.3%).
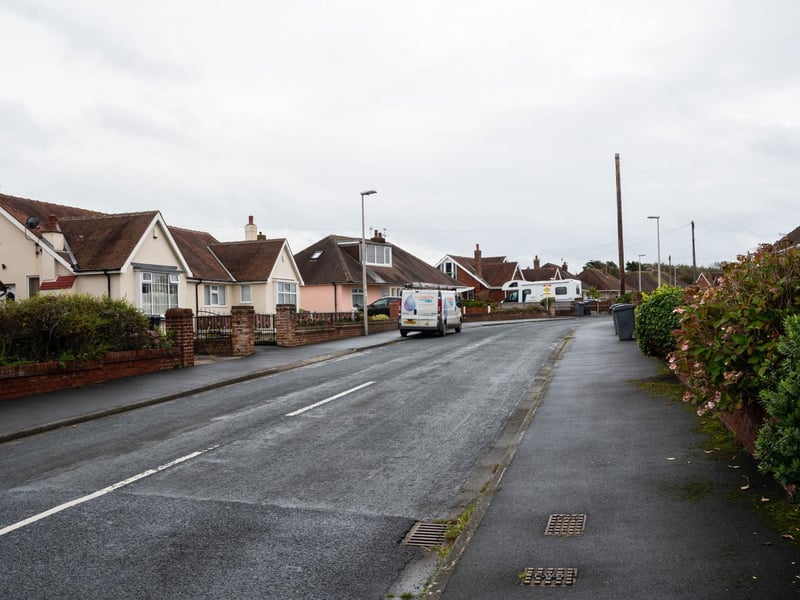
11. Little Bispham & Anchorsholme
With a case rate of 428.0 per 100,000 people, Little Bispham & Anchorsholme recorded 33 cases down by 5 (-13.2%).
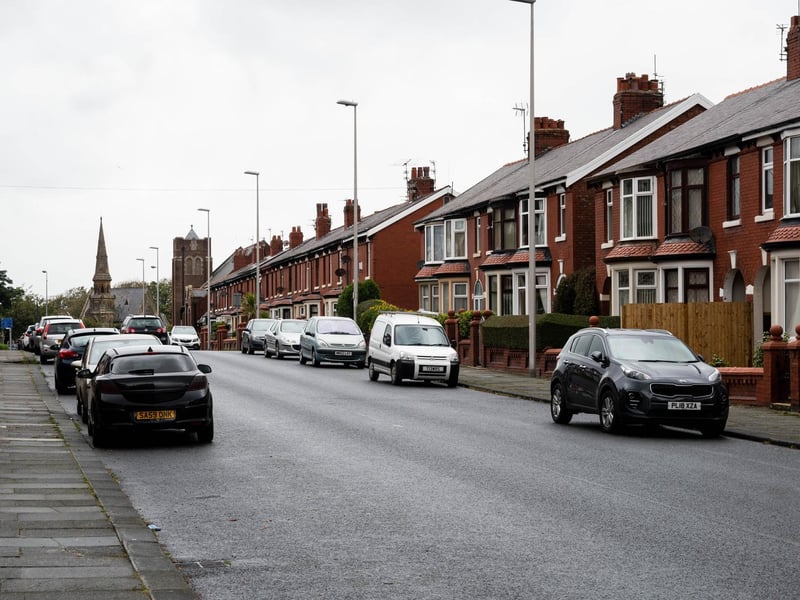
12. Queenstown & Layton
With a case rate of 420.4 per 100,000 people, Queenstown & Layton recorded 34 cases Up by 2 (6.2%).