


Each school's score shows how it compares to the national average. The data included here is as follows: School / Progress score and description / Percentage achieving grade 5 or above in English and Maths GCSEs. The progress score shows how much progress pupils at this school made between the end of key stage 2 and the end of key stage 4, compared to pupils across England who got similar results at the end of key stage 2. The following school were omitted due to a lack of, or incomplete data: Rossall School, AKS Lytham, The St Annes College Grammar School, Kirkham Grammar School & Armfield Academy. Read more>>> Union warns school performance measures are not ‘perfect’
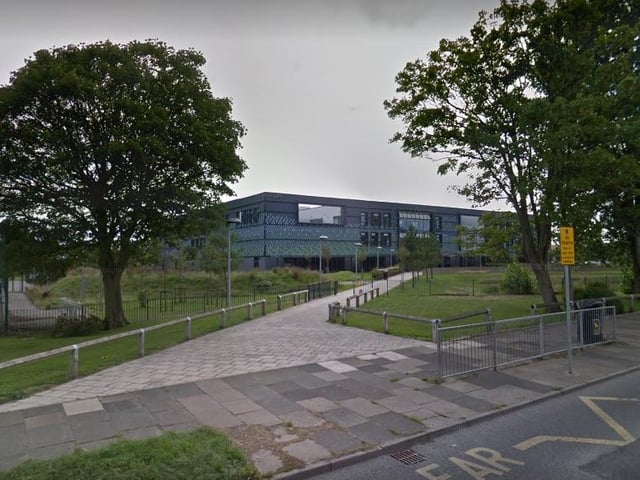
7. Highfield Leadership Academy
Well below average-0.95 | Grade 5 or above inEnglish and maths GCSEs 25% | other Photo: Google
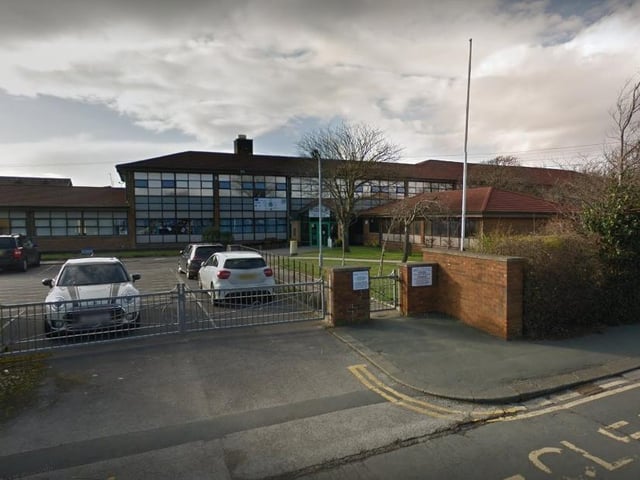
8. Lytham St Annes High School
Average 0.01 | Grade 5 or above inEnglish and maths GCSEs - 46% | other Photo: Google
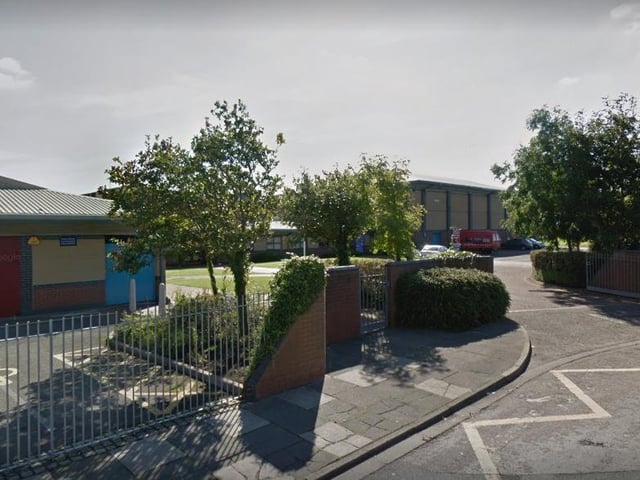
9. Millfield Science & Performing Arts
Below average -0.26 | Grade 5 or above inEnglish and maths GCSEs - 38% | other Photo: Google
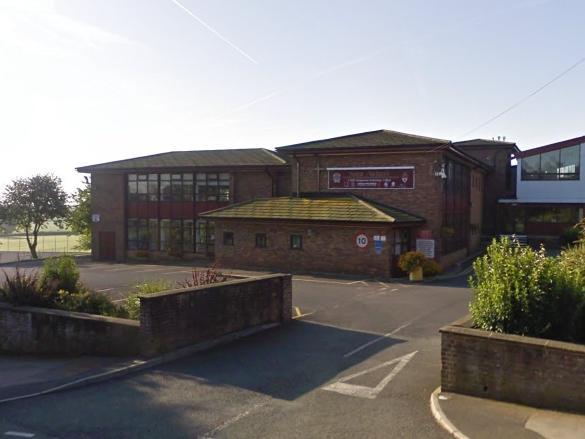
10. Montgomery Academy
Well below average-0.64 | Grade 5 or above inEnglish and maths GCSEs - 29% | other Photo: Google
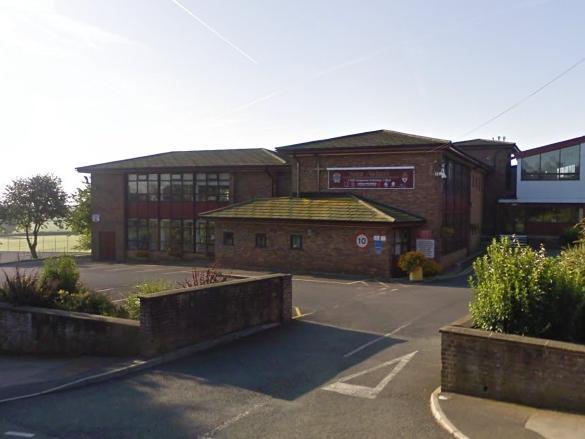
11. Saint Aidans CoE High School
Below average -0.22 | Grade 5 or above inEnglish and maths GCSEs - 54% | other Photo: Google
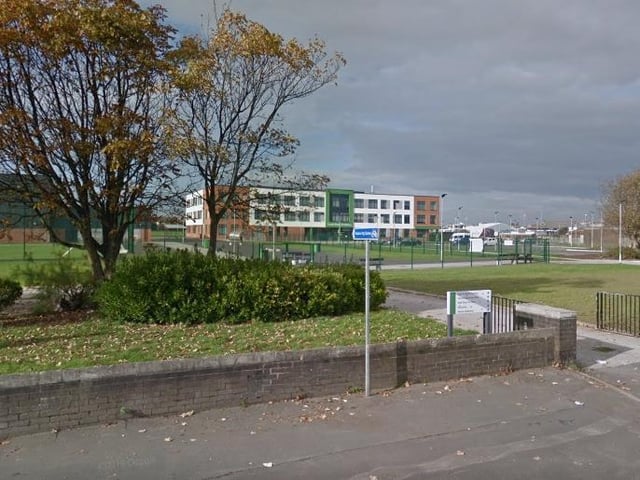
12. South Shore Academy
Well below average-1.54 | Grade 5 or above inEnglish and maths GCSEs - 3% | other Photo: Google