Blackpool, Wyre and The Fylde 2016 league tables: How does your school fare?


Despite the controversy surrounding last May’s Key Stage Two tests most schools proved they have bucked the national trend and are improving.
Lancashire’s education authority, which includes Wyre and Fylde, is among the top third and the county boasts more good and outstanding schools than both the regional and national averages - especially at primary level.
Advertisement
Hide AdAdvertisement
Hide AdThe performance of primary school pupils in recent national tests has been praised by Lancashire County Council’s cabinet member for children, young people and schools.


County Coun Matthew Tomlinson said: “Once again, the Key Stage Two results are really pleasing.
“Our primary school children are doing well above the national and regional average in the key areas of reading, writing and maths, which is definitely something we can be proud of.
“This shows what excellent work our schools are doing. They have obviously got to grips with a new, and more demanding curriculum, and it is great to see Lancashire children performing so well.
Advertisement
Hide AdAdvertisement
Hide Ad“Well done to all our children, and to their teachers, parents, and school governors. These results are a compliment to all their hard work.”


Changes to the primary school end of Key Stage One and Two tests were steeped in problems caused by a host of changes and last minute alterations to the test and assessment process as well as test papers being leaked online.
This led to some parents and pupils threatening to boycott the tests and teachers, pupils and parents took to the streets to protest.
Although the tests went ahead, the Government revealed that just over half, of the nation’s pupils achieved the expected targets.
Advertisement
Hide AdAdvertisement
Hide AdThe House of Commons Education Committee is carrying out an inquiry into primary assessment.


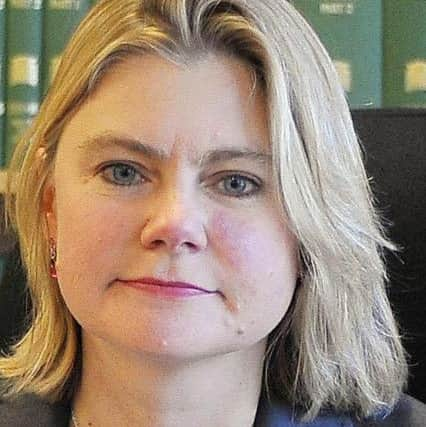
Although Education Secretary Justine Greening recently made some concessions, following a debacle with last year’s tests which saw boycotts and protest by pupils, the group said they are still deeply flawed and the same tests are set to take place this year.
Almost 200,000 children at primary schools are considered to be underperforming, in the wake of controversial changes to SATs tests, official figures show.
In total, 665 mainstream primaries in England fell below the Government’s floor standard this year, according to the Department for Education (DfE).
Advertisement
Hide AdAdvertisement
Hide AdThe statistics also show wide regional variations, with children in London the most likely to get a decent education, while those in the South West and the East Midlands are the least likely to get access to a good primary school.


The latest data come after a tumultuous year for primary assessment, including major changes to toughen up the tests and concerns raised by teachers and school leaders about pressure on pupils and unreliability of results.
School Standards Minister Nick Gibb said this year’s SATs tests - or national curriculum tests - are the first to test pupils on a new primary curriculum introduced in 2014, which was brought in to “raise expectations” and ensure youngsters get a good grounding in the basics.
But one union leader slammed the results, saying the data “is not worth the paper it is written on.”
Blackpool schools
Advertisement
Hide AdAdvertisement
Hide AdSchool name / Number of pupils / Reading - Percentage making expected progress / Writing - Percentage making expected progress / Maths - Percentage making expected progress / Percentage making standard in reading, writing and maths
Anchorsholme Primary Academy / 85 / 67% / 80% / 71% / 58%
Baines’ Endowed Primary School / 66 / 55% / 77% / 76% / 48%
Bispham Endowed CofE Primary / 56 / 79% / 88% / 73% / 66%
Blackpool St John’s CofE Primary / 30 / 97% / 87% / 93% / 77%
Blackpool St Nicholas CofE Primary / 58 / 62% / 72% / 66% / 45%
Boundary Primary School Blackpool / 59 / 32% / 76% / 85% / 27%
Advertisement
Hide AdAdvertisement
Hide AdChrist The King Catholic Academy / 30 / 70% / 70% / 80% / 60%
Claremont Community Primary School / 59 / 58% / 75% / 68% / 51%
Devonshire Primary Academy / 59 / 49% / 63% / 75% / 44%
Hawes Side Academy Blackpool / 89 / 70% / 88% / 67% / 54%
Holy Family Catholic Primary School / 31 / 71% / 81% / 81% / 61%
Kincraig Primary School Blackpool / 20 / 80% / 95% / 90% / 80%
Langdale Free School Blackpool / 13 / 77% / 85% / 54% / 46%
Advertisement
Hide AdAdvertisement
Hide AdLayton Primary School Blackpool / 90 / 89% / 7.1 / 84% / 4.1 / 97% / 7.8 / 82%
Marton Primary Academy and Nursery / 56 / 55% / 75% / 61% / 36%
Mereside Primary School Blackpool / 29 / 48% / 76% / 48% / 28%
Moor Park Primary School Blackpool / 60 / 70% / 80% / 72% / 42%
Norbreck Primary Academy / 85 / 62% / 75% / 61% / 49%
Our Lady of the Assumption / 27 / 48% / 67% / 56% / 33%
Advertisement
Hide AdAdvertisement
Hide AdRevoe Learning Academy Blackpool / 57 / 47% / 72% / 72% / 47%
Roseacre Primary Academy Blackpool / 88 / 64% / 77% / 70% / 51%
St Bernadette’s Catholic Primary / 30 / 67% / 87% / 80% / 57%
St Cuthbert’s Catholic Academy / 28 / 43% / 64% / 57% / 39%
St John Vianney’s Catholic Primary / 59 / 61% / 188% / 66% / 47%
Advertisement
Hide AdAdvertisement
Hide AdSt Kentigern’s Catholic Primary School / 29 / 72% / 62% / 69% / 55%
St Teresa’s Catholic Primary School / 28 / 61% / 79% / 54%= / 39%
Stanley Primary School Blackpool / 89 / 49% / 72% / 63% / 38%
Thames Primary Academy Blackpool / 59 / 49% / 73% / 69% / 37%
Advertisement
Hide AdAdvertisement
Hide AdUnity Academy Blackpool Blackpool / 59 / 51% / 73% / 63% / 34%
Waterloo Primary School Blackpool / 88 / 68% / 83% / 55% / 47%
Westcliff Primary School Blackpool / 30 / 57% / 77% / 77% / 43%
Fylde and Wyre
School name / Number of pupils / % of pupils reaching expected level in maths / % of pupils reaching expected level in reading / % of pupils reaching expected level in writing / Percentage of pupils reaching expected level in Maths, reading and English
Ansdell Primary School / 39 / 92% / 79% / 82% / 67%
Advertisement
Hide AdAdvertisement
Hide AdCarleton Green Community Primary School / 45 / 76% / 64% / 69% / 51%
Carleton St Hilda’s Church of England Primary School / 30 / 87% / 73% / 93% / 70%
Carter’s Charity Voluntary Controlled Primary School, Preesall / 22 / 50% / 59% / 77% / 41%
Charles Saer Community Primary School / 34 / 74% / 47% / 74% / 41%
Clifton Primary School / 36 / 56% / 50% / 67% / 42%
Advertisement
Hide AdAdvertisement
Hide AdFleetwood Chaucer Community Primary School / 38 / 58% / 34% / 71% / 29%
Fleetwood Flakefleet Primary School / 52 / 54% / 38% / 67% / 29%
Great Arley School / 6 / 0% / 0% / 0% / 0%
Hambleton Primary Academy / 32 / 97% / 97% / 97% / 94%
Heyhouses Endowed Church of England Primary School / 83 / 69% / 65% / 77% / 57%
Larkholme Primary School / 28 / 75% / 64% / 82% / 61%
Lytham Church of England Voluntary Aided Primary School / 35 / 66% / 74% / 66% / 63%
Advertisement
Hide AdAdvertisement
Hide AdLytham Hall Park Primary School / 39 / 90% / 90% / 90% / 85%
Lytham St Annes Mayfield Primary School / 59 / 54% / 49% / 69% / 34%
Northfold Community Primary School / 30 / 83% / 83% / 80% / 70%
Our Lady Star of the Sea Catholic Primary School / 30 / 97% / 100% / 90% / 87%
Advertisement
Hide AdAdvertisement
Hide AdPoulton-le-Fylde Carr Head Primary School / 34 / 65% / 68% / 71% / 53%
Poulton-le-Fylde St Chad’s CofE Primary School / 35 / 100% / 94% / 89% / 83%
Poulton-le-Fylde the Breck Primary School / 37 / 100% / 97% / 95% / 92%
Preesall Fleetwood’s Charity Church of England Primary School / 20 / 75% / 95% / 85% / 75%
Advertisement
Hide AdAdvertisement
Hide AdSacred Heart Catholic Primary School, Thornton Cleveleys / 30 / 70% / 80% / 73% / 60%
Shakespeare Primary School / 57 / 89% / 81% / 72% / 65%
Singleton Church of England Voluntary Aided Primary School / 15 / 93% / 87% / 93% / 80%
St Annes on Sea St Thomas’ Church of England Primary School / 29 / 90% / 86% / 83% / 69%
St John’s Catholic Primary School, Poulton-le-Fylde / 30 / 93% / 67% / 90% / 67%
Advertisement
Hide AdAdvertisement
Hide AdSt Mary’s Catholic Primary School, Fleetwood / 18 / 89% / 78% / 83% / 78%
St Peter’s Catholic Primary School, Lytham / 32 / 81% / 75% / 78% / 56%
St Wulstan’s and St Edmund’s Catholic Primary School and Nursery / 42 / 45% / 55% / 67% / 29%
Staining Church of England Voluntary Controlled Primary School / 32 / 66% / 50% / 63% / 47%
Stalmine Primary School / 11 / 36% / 27% / 73% / 18%
Stanah Primary School / 57 / 79% / 61% / 74% / 53%
Advertisement
Hide AdAdvertisement
Hide AdThornton Cleveleys Baines Endowed Voluntary Controlled Primary School / 34 / 94% / 79% / 79% / 74%
Thornton Cleveleys Manor Beach Primary School / 45 / 53% / 51% / 58% / 38%
Thornton Cleveleys Royles Brook Primary School / 43 / 72% / 58% / 67% / 47%
Thornton Primary School / 17 / 59% / 71% / 76% / 53%
Thornton-Cleveleys Red Marsh School / 10 / 0% / 0% / 0% / 0%