This is the latest R rate for the North West and what it means


The government does not publish the figures - used to determine how rapidly Covid-19 is spreading - on a regional level, but is coming under pressure to do so.
Great Manchester mayor Andy Burnham shared the latest estimates, saying people have a right to know amid suggestions local lockdowns could be used in future to tackle isolated outbreaks.
Advertisement
Hide AdAdvertisement
Hide AdHe said: "It was the Government which put the R number centre stage but they are failing to give a regional breakdown.
"I believe I am very much doing my job by bringing this information to public attention and I will continue to publish these stats every week until the Government does.
"The Government should take this process over and publish more up-to-date figures. We will keep challenging them until they do"
So what do the experts say about the R number in the North West?
Advertisement
Hide AdAdvertisement
Hide AdThe R is currently estimated at 0.8 in the North West, according to the Centre for Mathematical Modelling of Infectious Diseases (CMMID).
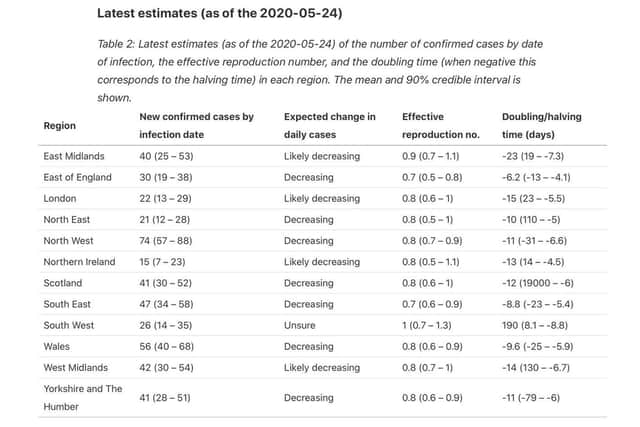
It says this is based on data provided up to May 24 (12 days ago), which is the most recent available due to an NHS time-lag in publishing test data.
What does this mean? Is it good or bad?
The figure, widely discussed in Government press conferences, tells us how many people, on average, an infected person will pass COVID-19 on to.
If the reproduction number is higher than 1, then the number of cases increases exponentially, i.e. it "snowballs like debt on an unpaid credit card", as one expert put it.
Advertisement
Hide AdAdvertisement
Hide AdBut if the number is lower than 1, the disease will eventually peter out, as not enough new people are being infected to sustain the outbreak.
How does this compare to the rest of the UK?
On Friday, June 2, the R rate for England was somewhere between 0.7 and 0.9, the Government said. It has not yet provided an R rate for each of the regions.
But the CMMID findings suggest that the North West R rate is on a par with regions across the UK.
As well as the North West, the R was estimated at 0.8 for London, North East, West Midlands, Yorkshire and the Humber, Wales, Scotland and Northern Ireland.
Advertisement
Hide AdAdvertisement
Hide AdThe East of England and South East fared better with a rate of 0.7, whereas the South West remained a cause for concern with a R of 1.0.
What is the R for my town/city?
It is not possible to calculate meaningful R values at a very local level because some of the data involves such low figures that even a small change in them can, in statistical terms, make a disproportionately big relative difference.
Blackpool director of public health Dr Arif Rajpura said local figures on their own are "somewhat unreliable", but are "more reliable at regional level".
How is the R calculated and why is it so complicated?
Calculating the R rate is very complex and it is impossible to calculate exactly.
Advertisement
Hide AdAdvertisement
Hide AdIt involves data from lots of different sources, such as confirmed cases, hospital admissions, deaths, patient surveys and testing.
Several groups of experts, from universities and Public Health England, then use the information to estimate the value of R.
These are all put together and used by experts to give a range of values that R is likely to fall between.