

But despite that, average house prices held up across England – even if there was a drop in sales.
It was the same picture in Blackpool, where prices rose by 2.3% in the year to September 2020. Across the North West, prices rose by 2.5%.
The ONS also publishes house price figures by Middle Layer Super Output Areas (MSOAs) – small geographic areas containing an average of 7,200 people.
These show 13 of the 19 MSOAs that make up Blackpool saw a rise in house prices over the same period.
Here we reveal which neighbourhoods saw the strongest growth in the year to September 2020.
The ONS also publishes house price figures by Middle Layer Super Output Areas (MSOAs) – small geographic areas containing an average of 7,200 people.
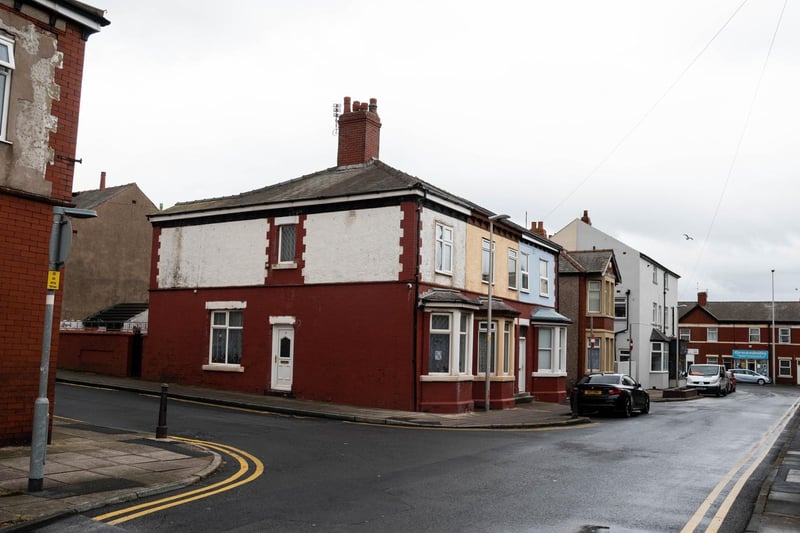
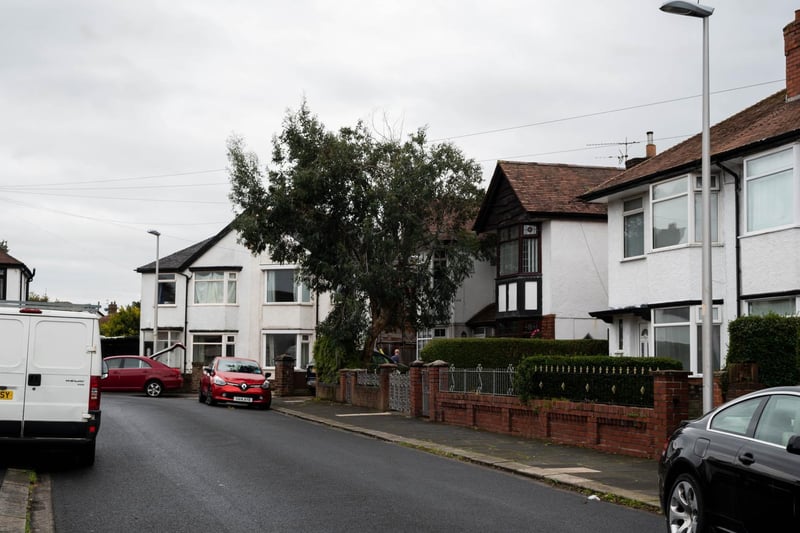
7. North East Centre
In North East Centre the average price rose to £85,198, up by 4% on the year to September 2019. Overall, 73 houses changed hands here between October 2019 and September 2020, a drop of 21%.
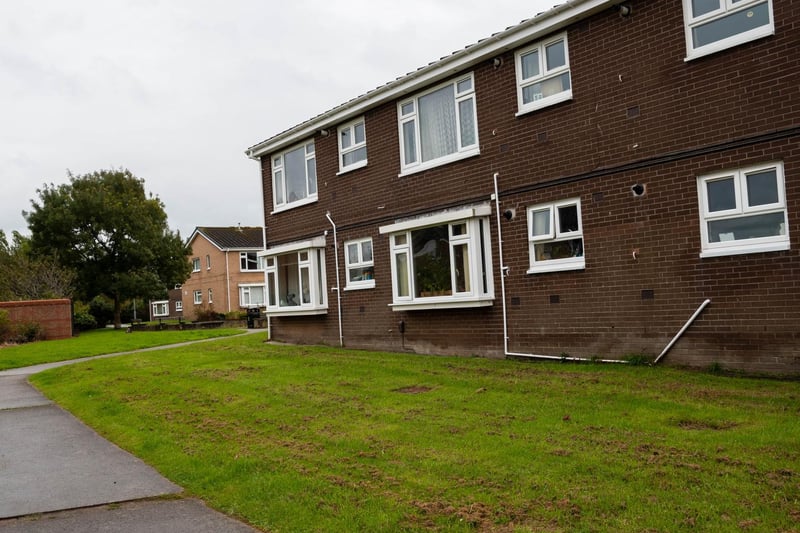
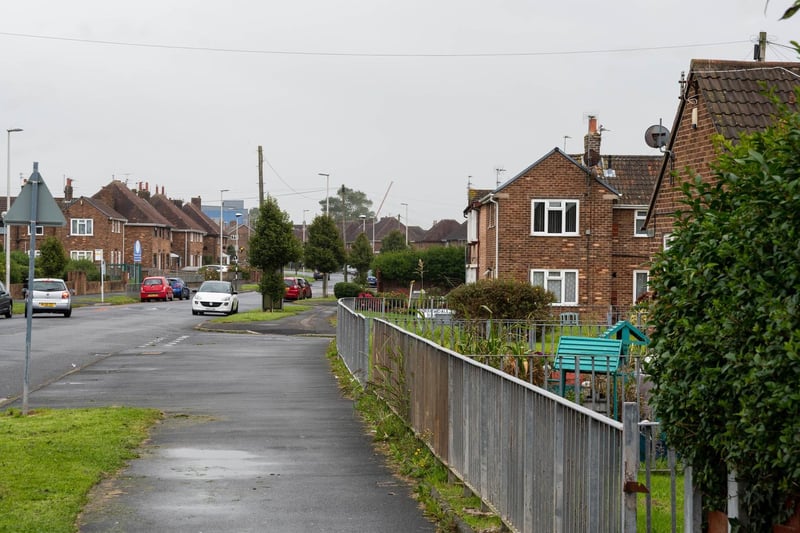
8. Churchtown
In Churchtown the average price rose to £136,848, up by 4.2% on the year to September 2019. Overall, 94 houses changed hands here between October 2019 and September 2020, a drop of 25%.
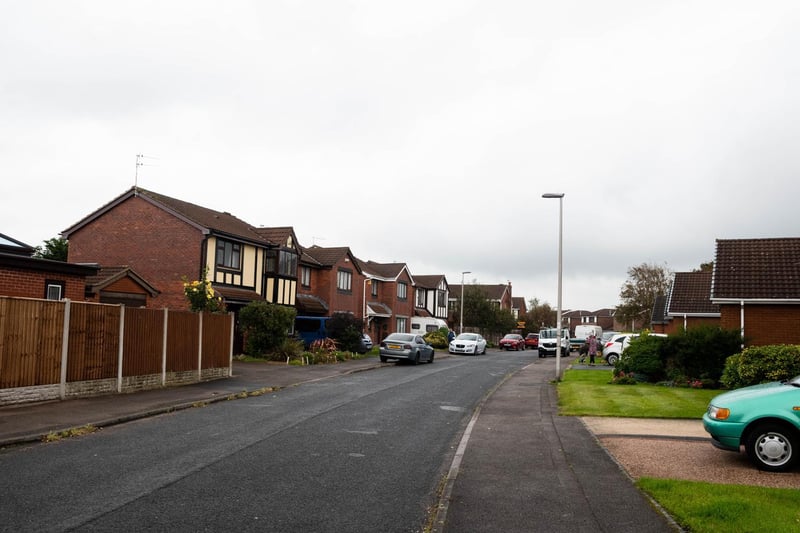
9. Common Edge
In Common Edge the average price rose to £171,600, up by 4.6% on the year to September 2019. Overall, 131 houses changed hands here between October 2019 and September 2020, a drop of 34%.
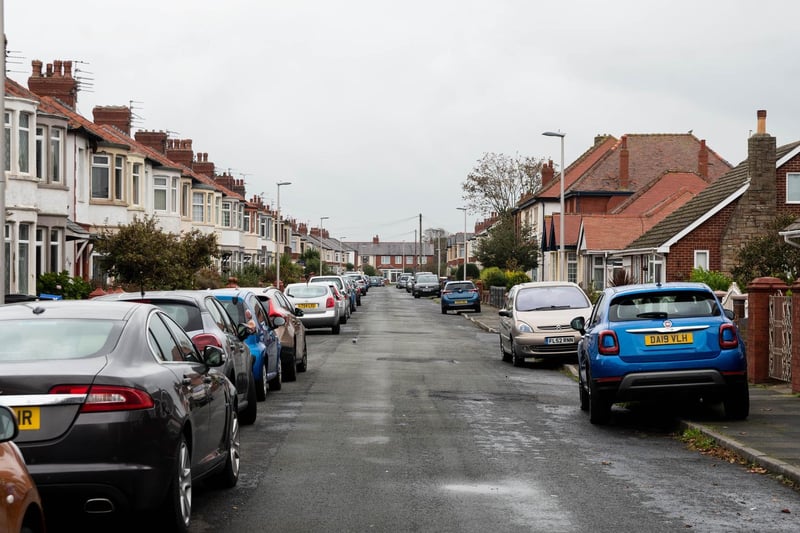
10. Squires Gate
In Squires Gate the average price rose to £150,158, up by 5.5% on the year to September 2019. Overall, 102 houses changed hands here between October 2019 and September 2020, a drop of 19%.
11. Warbreck & Bispham Road
In Warbreck & Bispham Road the average price rose to £124,920, up by 6.2% on the year to September 2019. Overall, 106 houses changed hands here between October 2019 and September 2020, a drop of 10%.
12. Little Marton & Marton Moss Side
In Little Marton & Marton Moss Side the average price rose to £146,711, up by 6.9% on the year to September 2019. Overall, 95 houses changed hands here between October 2019 and September 2020, a drop of 27%.